Solution

CI/CD - Docker Hub Tags
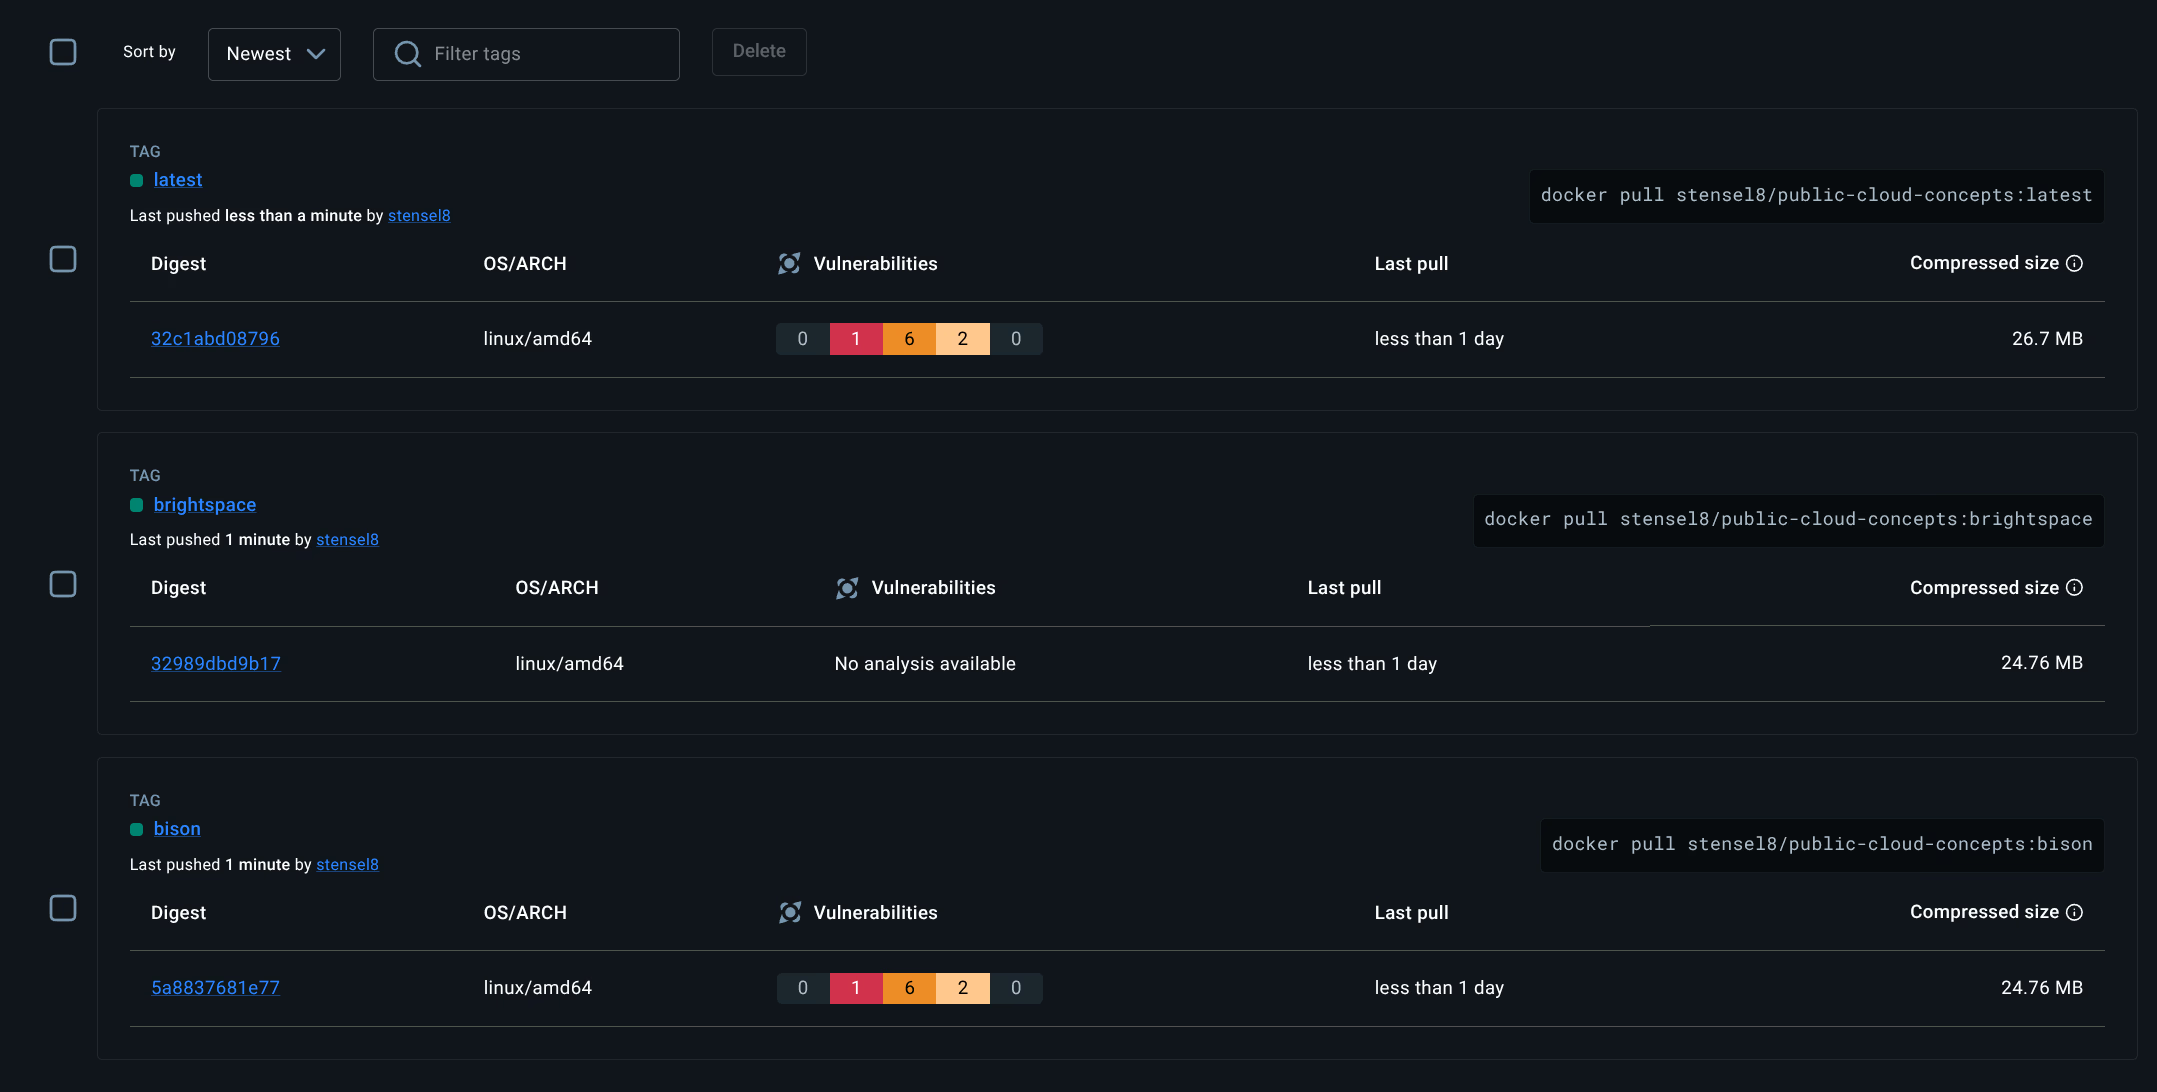
The GitHub Actions workflow builds two images and pushes them to stensel8/public-cloud-concepts:
| Image | Tag | Pull command |
|---|---|---|
| Bison app | bison | docker pull stensel8/public-cloud-concepts:bison |
| Brightspace app | brightspace | docker pull stensel8/public-cloud-concepts:brightspace |
2.2 Kubernetes
Assignment 2.2a - Deployment running
The Week 1 deployment (first-deployment) is running on the kubeadm cluster with both pods active in two regions:
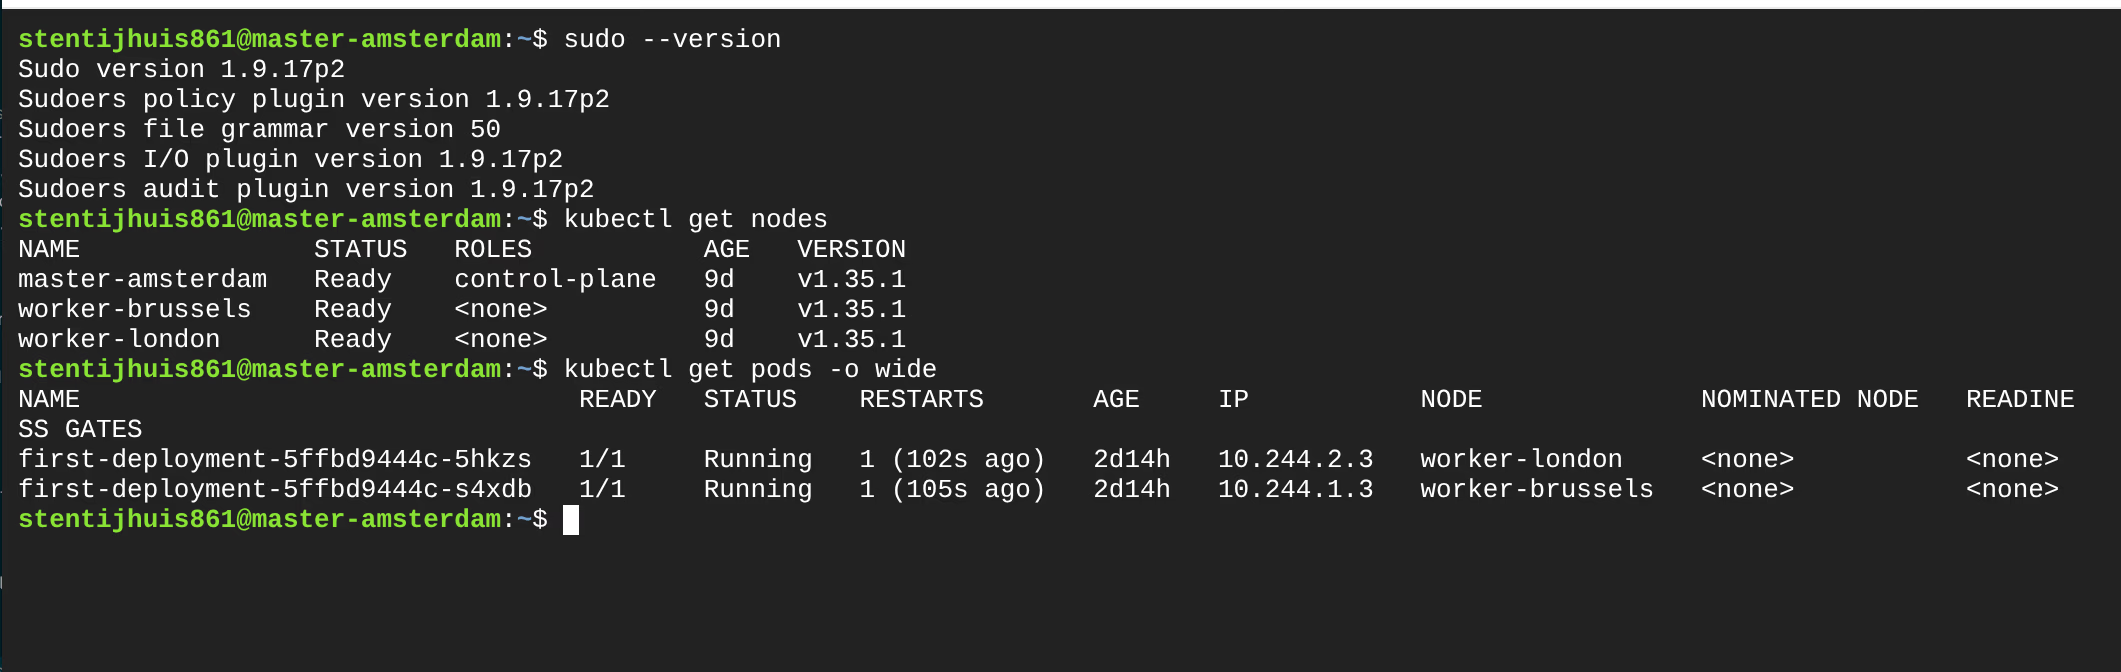
NAME               STATUS   ROLES           AGE   VERSION
master-amsterdam   Ready    control-plane   9d    v1.35.1
worker-brussels    Ready    <none>          9d    v1.35.1
worker-london      Ready    <none>          9d    v1.35.1

NAME                                READY   STATUS    IP           NODE
first-deployment-5ffbd9444c-5hkzs   1/1     Running   10.244.2.3   worker-london
first-deployment-5ffbd9444c-s4xdb   1/1     Running   10.244.1.3   worker-brussels
Assignment 2.2b - Deleting and recreating a pod
A pod was deleted while the Deployment remained active. Kubernetes automatically created a replacement pod with a different IP address, demonstrating that pod IPs are ephemeral.
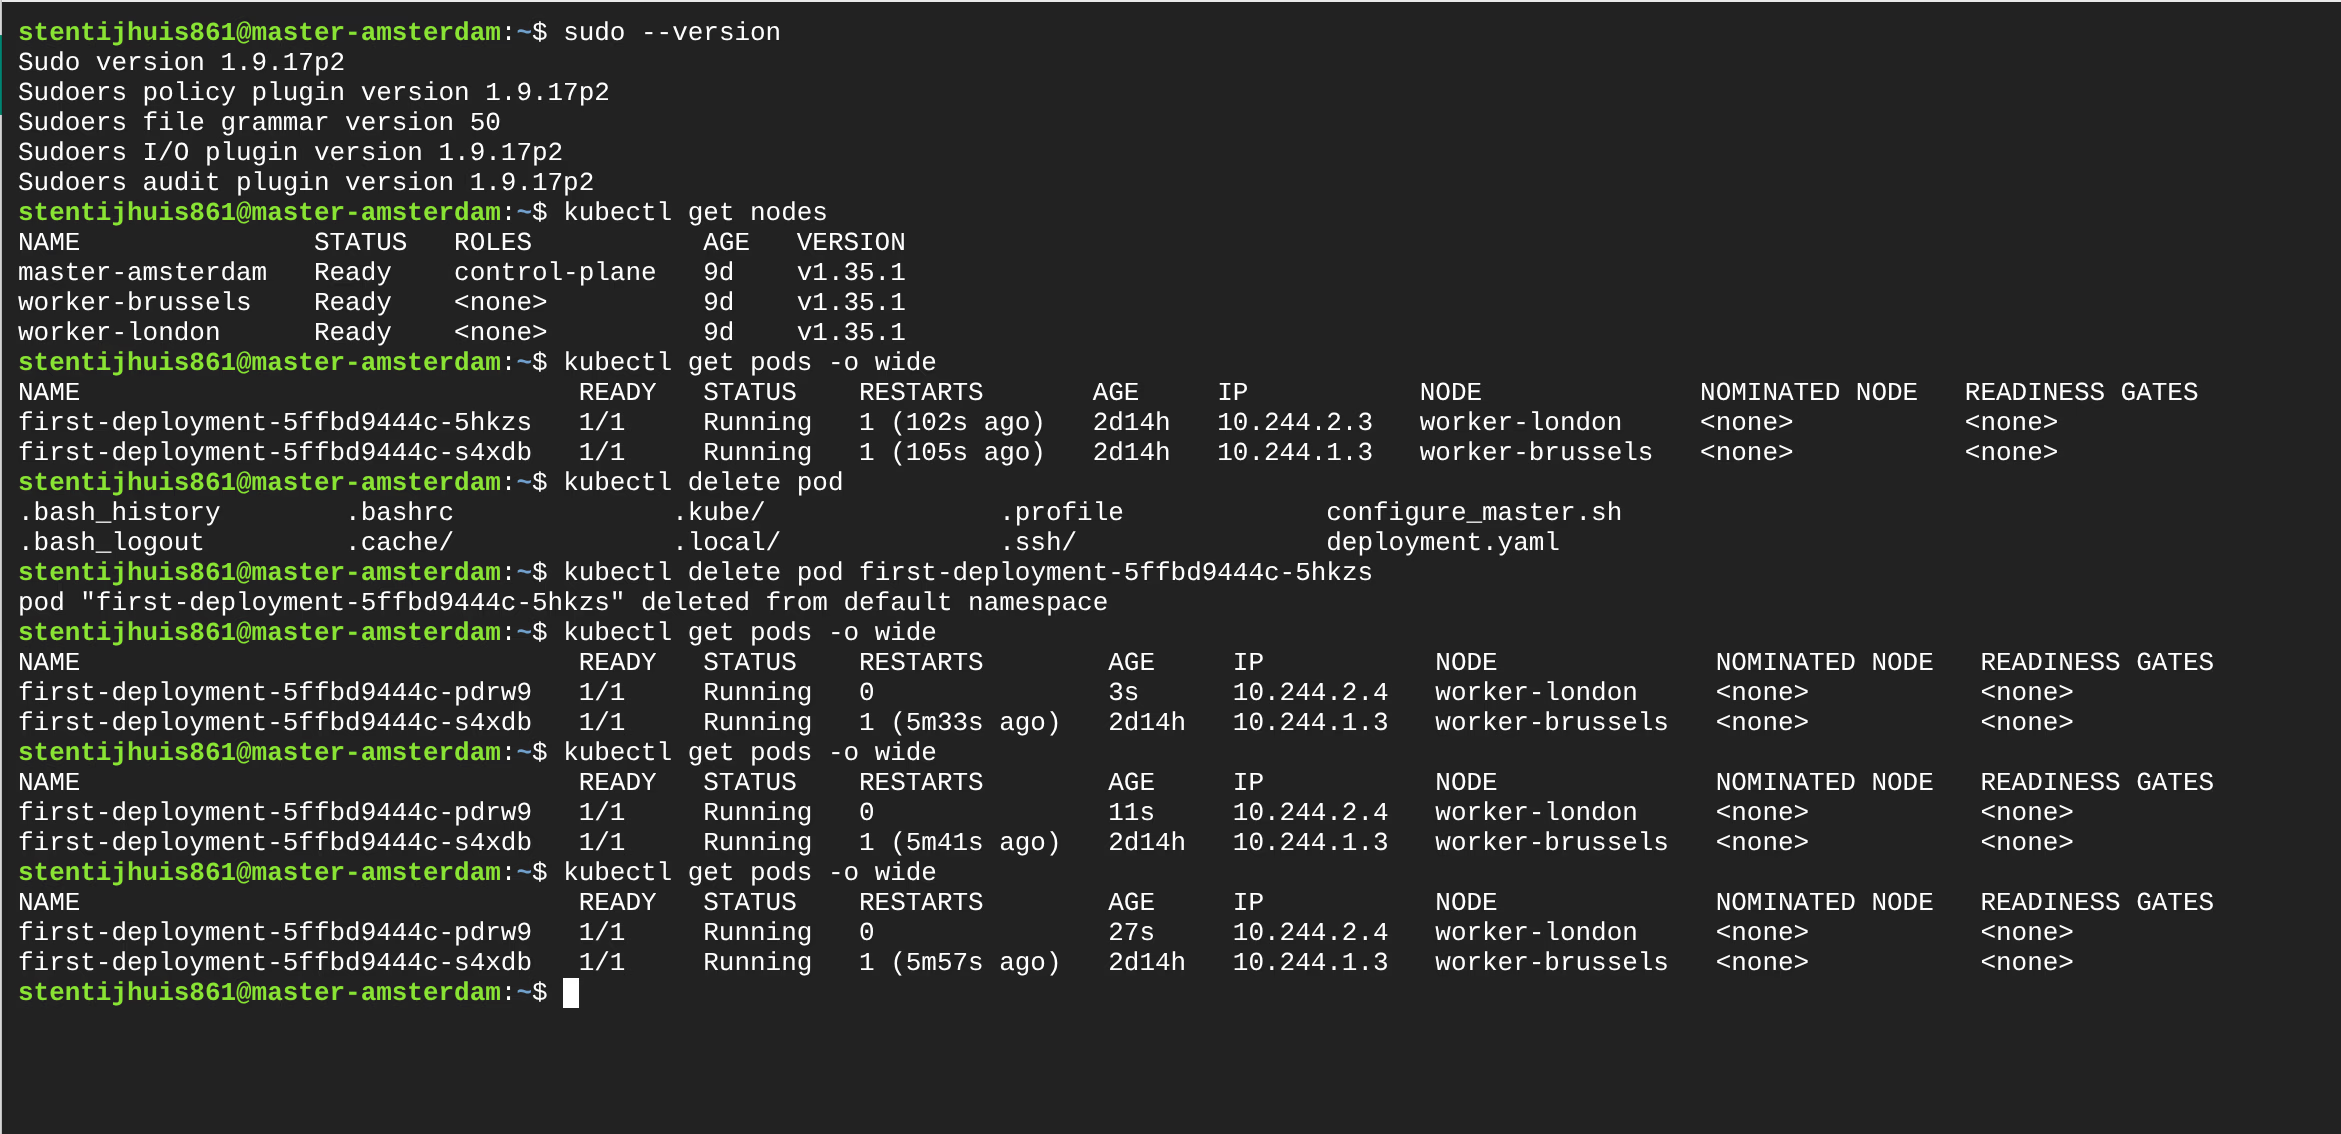
# Before deletion:
first-deployment-5ffbd9444c-5hkzs   IP: 10.244.2.3   worker-london

# After deletion - new pod:
first-deployment-5ffbd9444c-pdrw0   IP: 10.244.2.4   worker-london
This is exactly why a Service is needed: pods are disposable and their IPs change.
Assignment 2.2c - ClusterIP Service
service.yml - A Service connects via selector to pods with the label app: my-container. The first version was ClusterIP: only reachable within the cluster, no external IP:
+apiVersion: v1
+kind: Service
+metadata:
+  name: first-service
+spec:
+  type: ClusterIP        # stable virtual IP, internal only
+  selector:
+    app: my-container    # connects to pods with this label
+  ports:
+    - port: 80
+      targetPort: 80
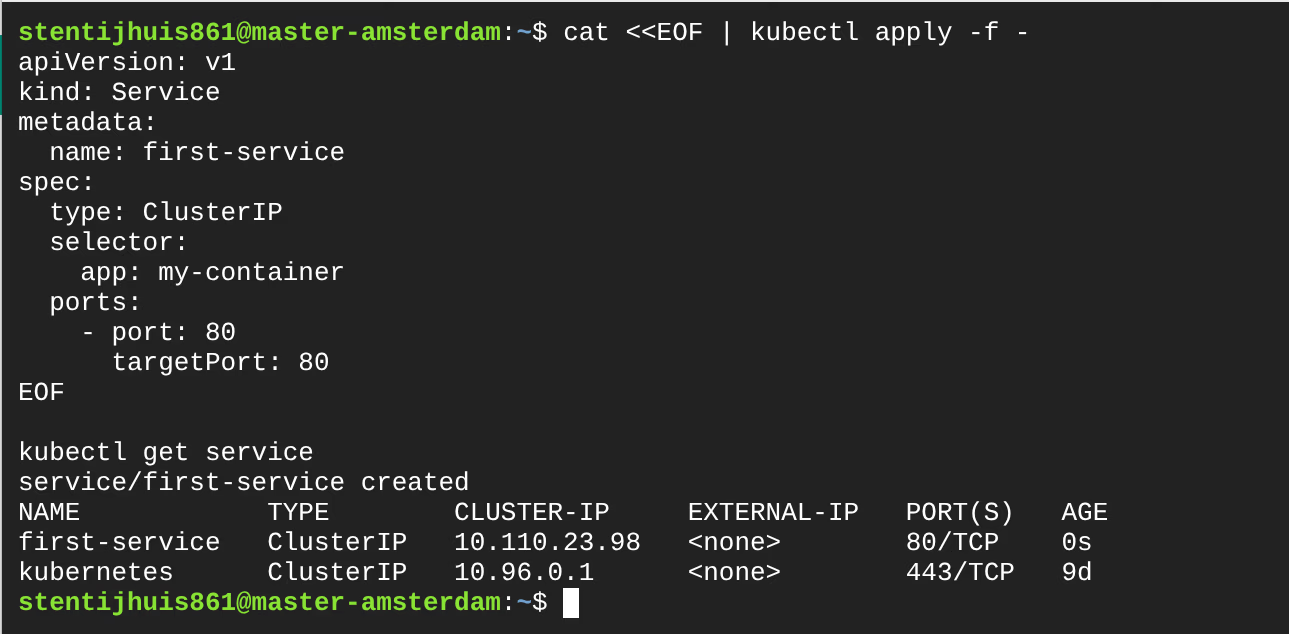
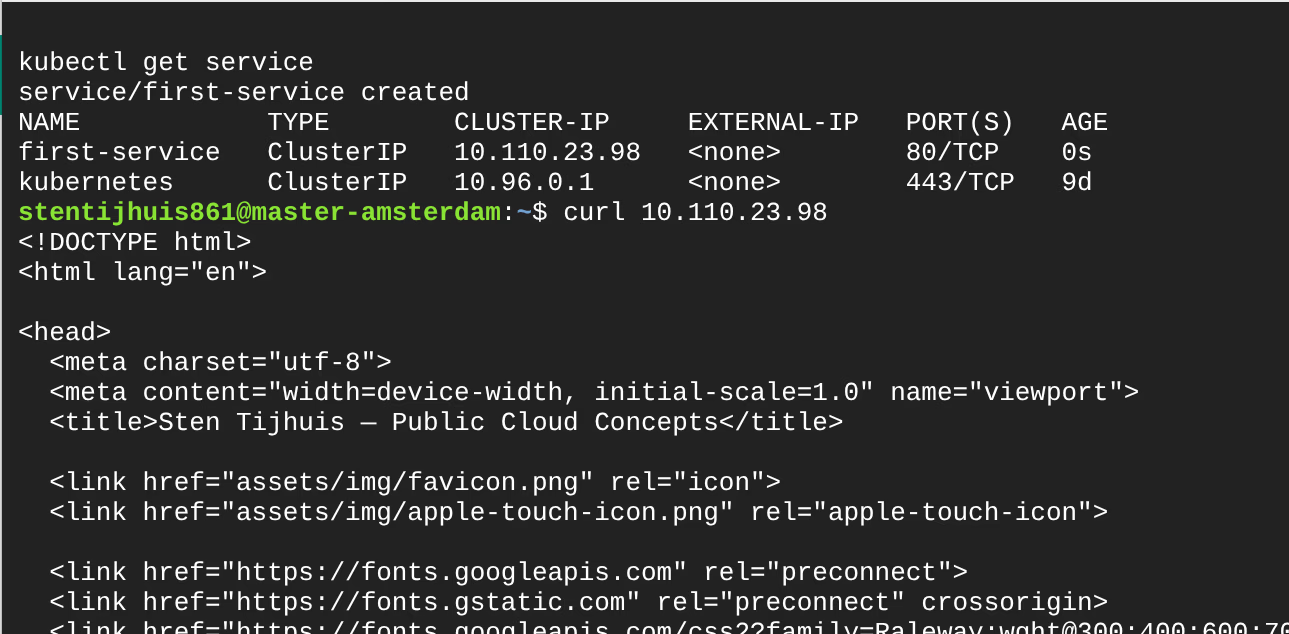
NAME            TYPE        CLUSTER-IP      EXTERNAL-IP   PORT(S)   AGE
first-service   ClusterIP   10.110.23.98    <none>        80/TCP    0s
The ClusterIP is only reachable from within the cluster. Traffic is load-balanced across all pods with selector app: my-container.
Assignment 2.2d - ClusterIP reachable from every node
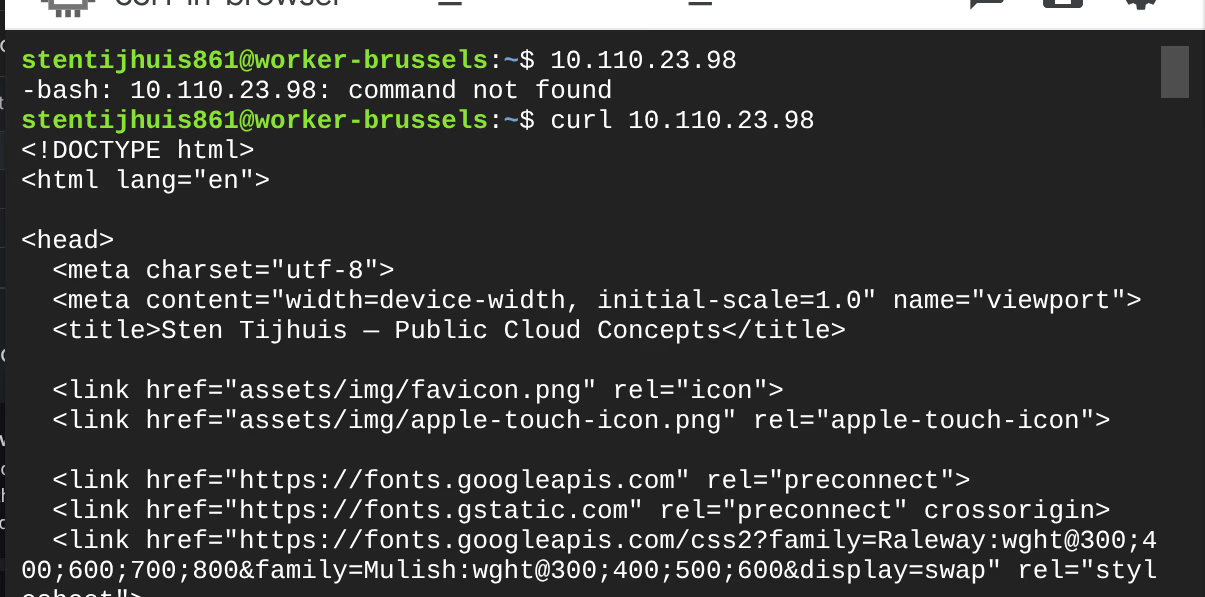
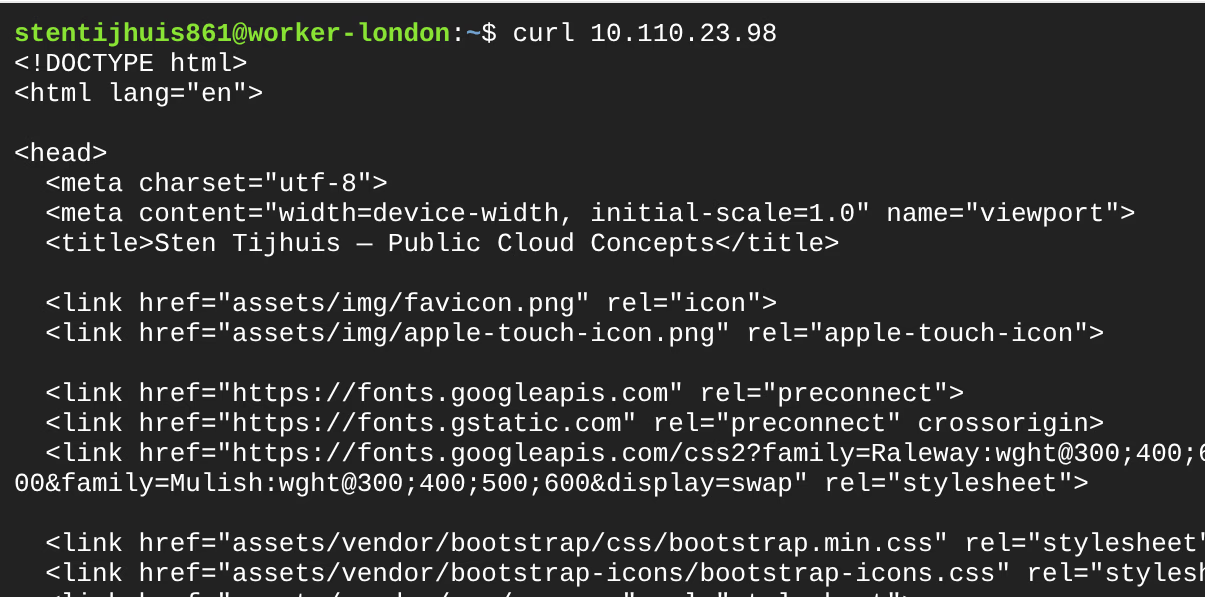
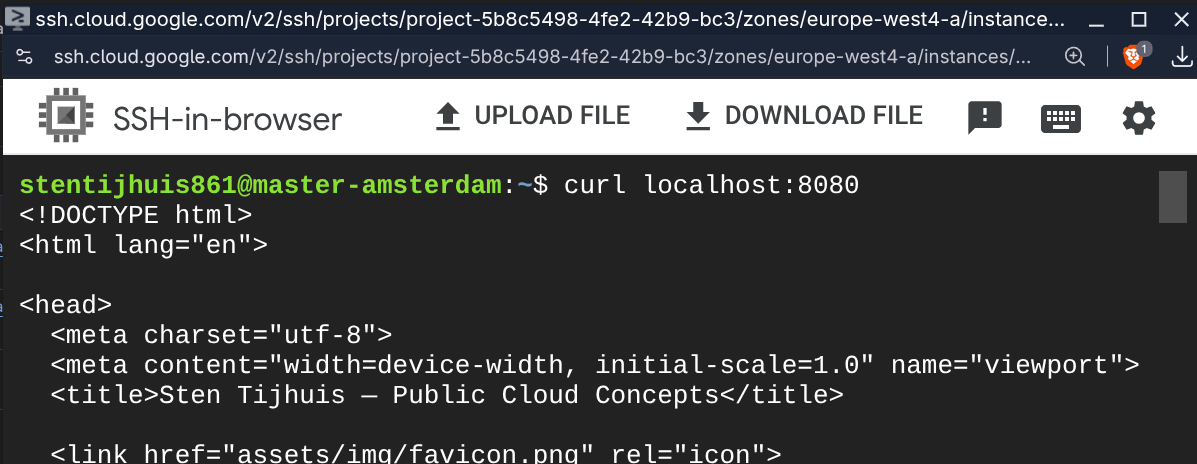
All three nodes returned the HTML response via curl 10.110.23.98.
Assignment 2.2e - NodePort Service
For external access, the type was changed to NodePort and a fixed port was added:
 spec:
-  type: ClusterIP
+  type: NodePort
   ports:
     - port: 80
       targetPort: 80
+      nodePort: 32490   # fixed port on all nodes (range: 30000-32767)
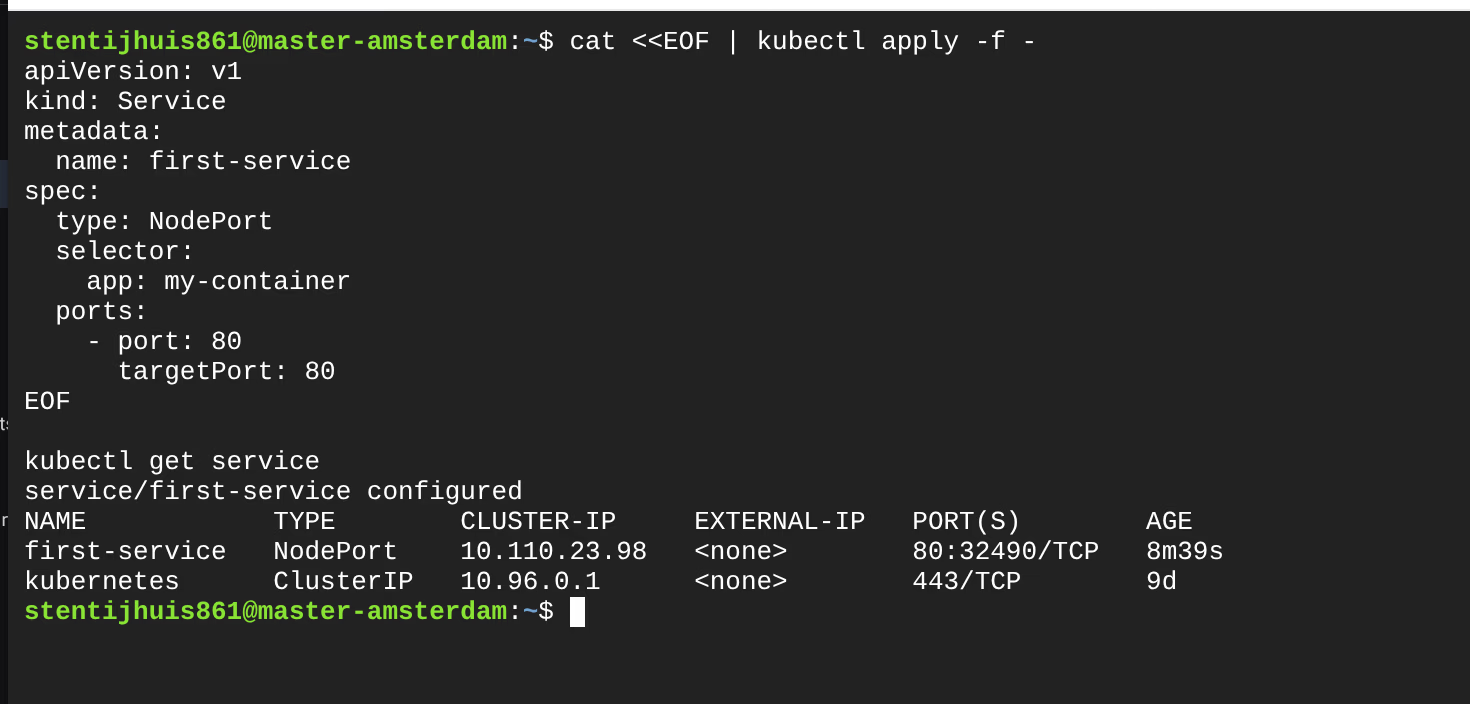
NAME            TYPE       CLUSTER-IP      EXTERNAL-IP   PORT(S)        AGE
first-service   NodePort   10.110.23.98    <none>        80:32490/TCP   8m39s
Looking up internal node IPs:

Testing via internal node IP:
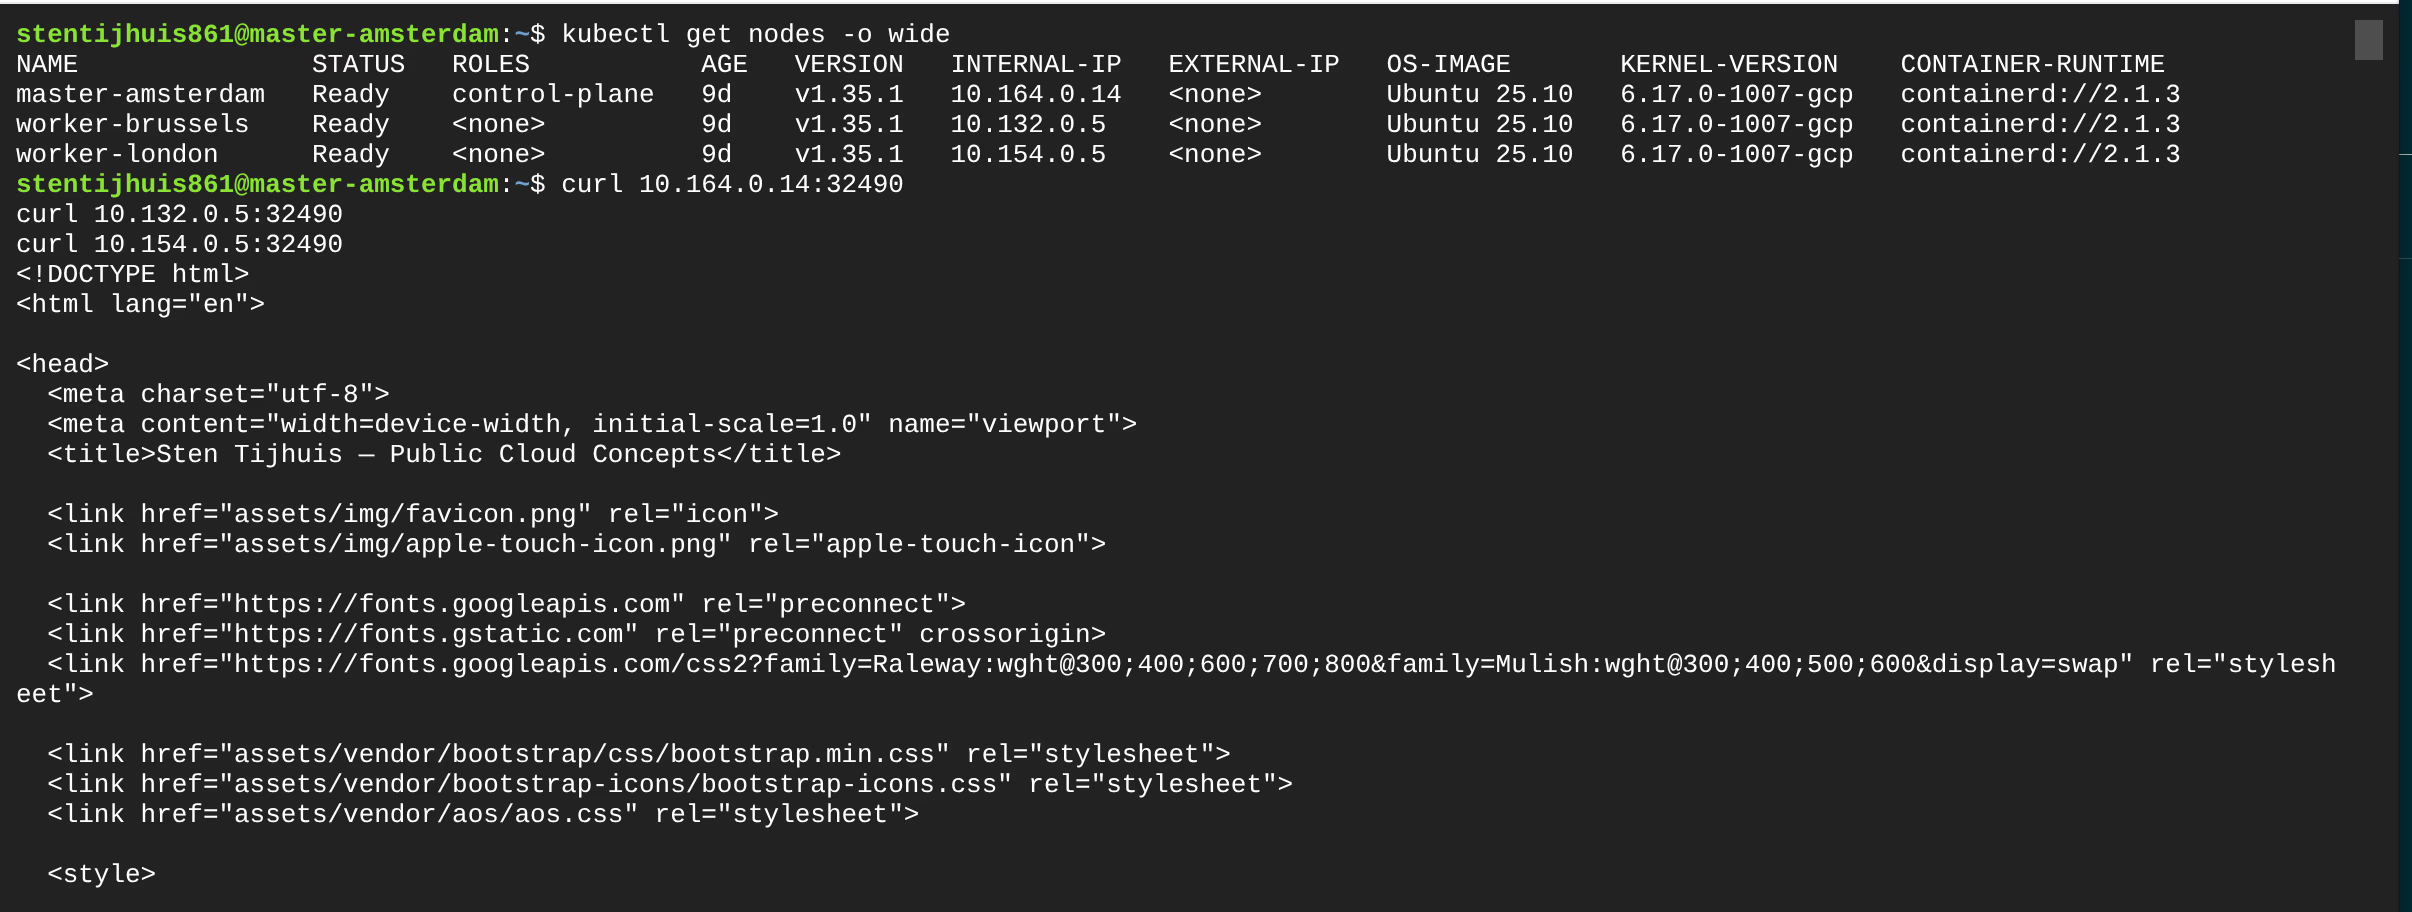
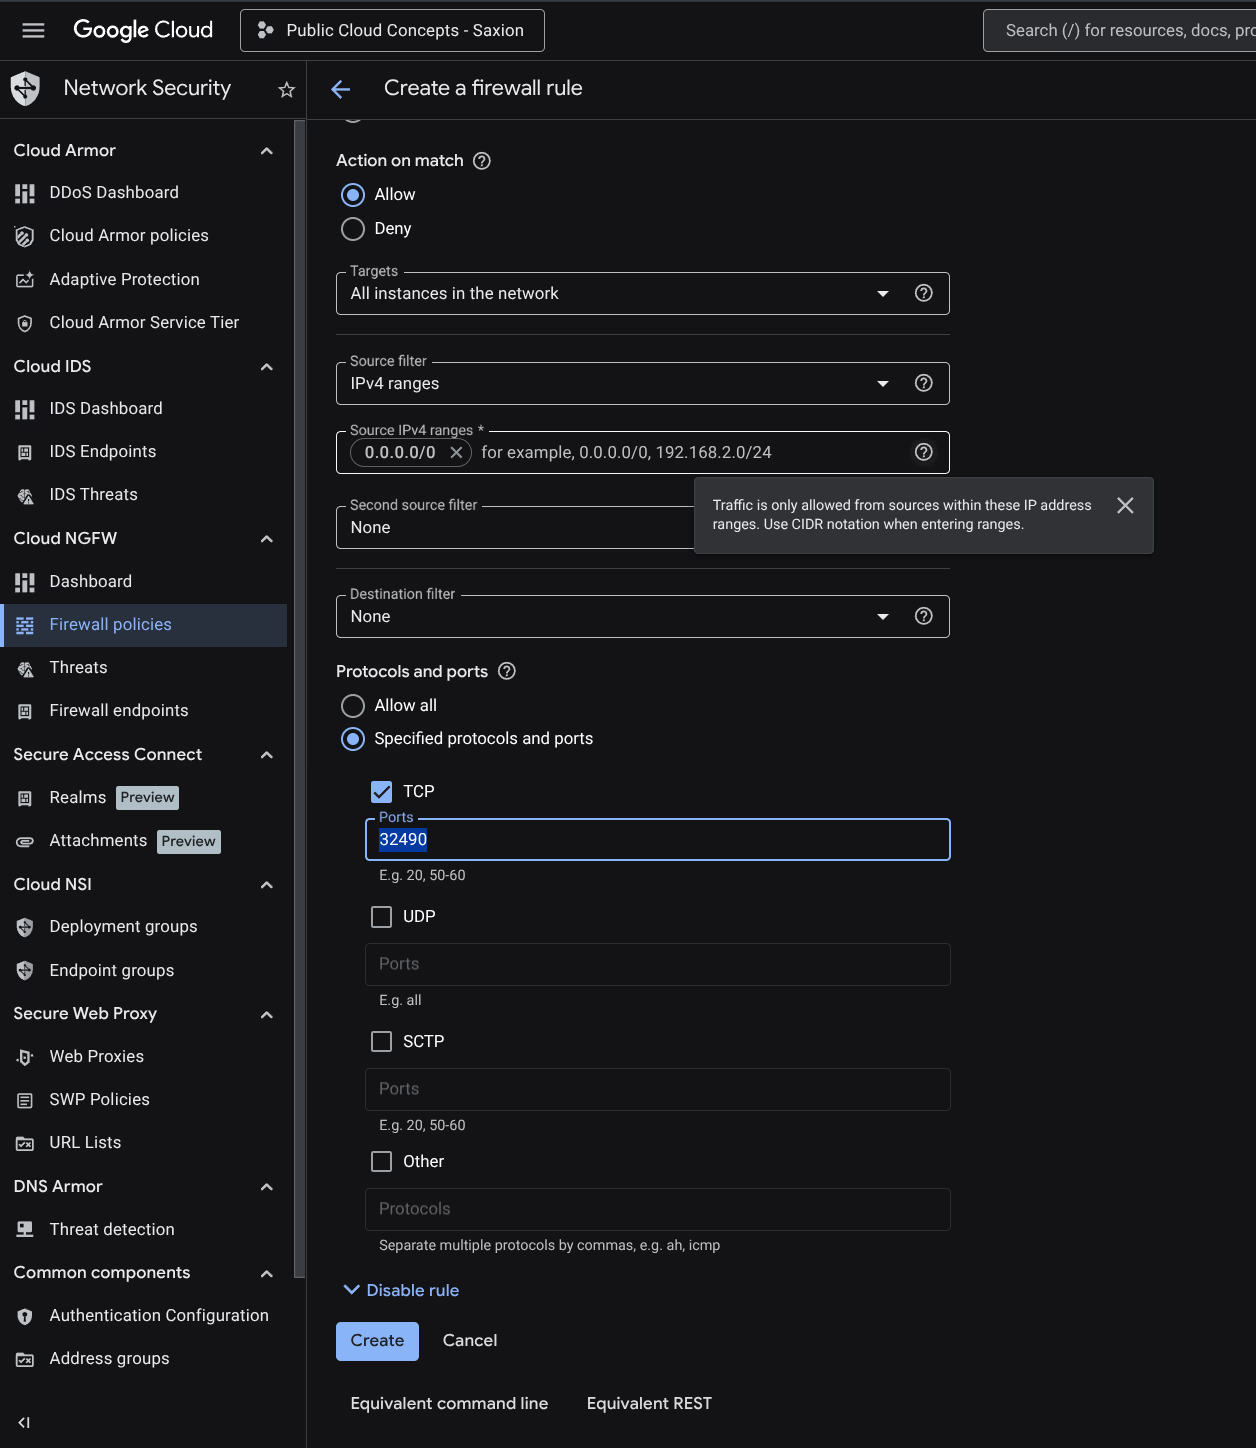
External access via NodePort + firewall rule:
GCP blocks incoming traffic by default. A firewall rule was created for TCP port 32490:
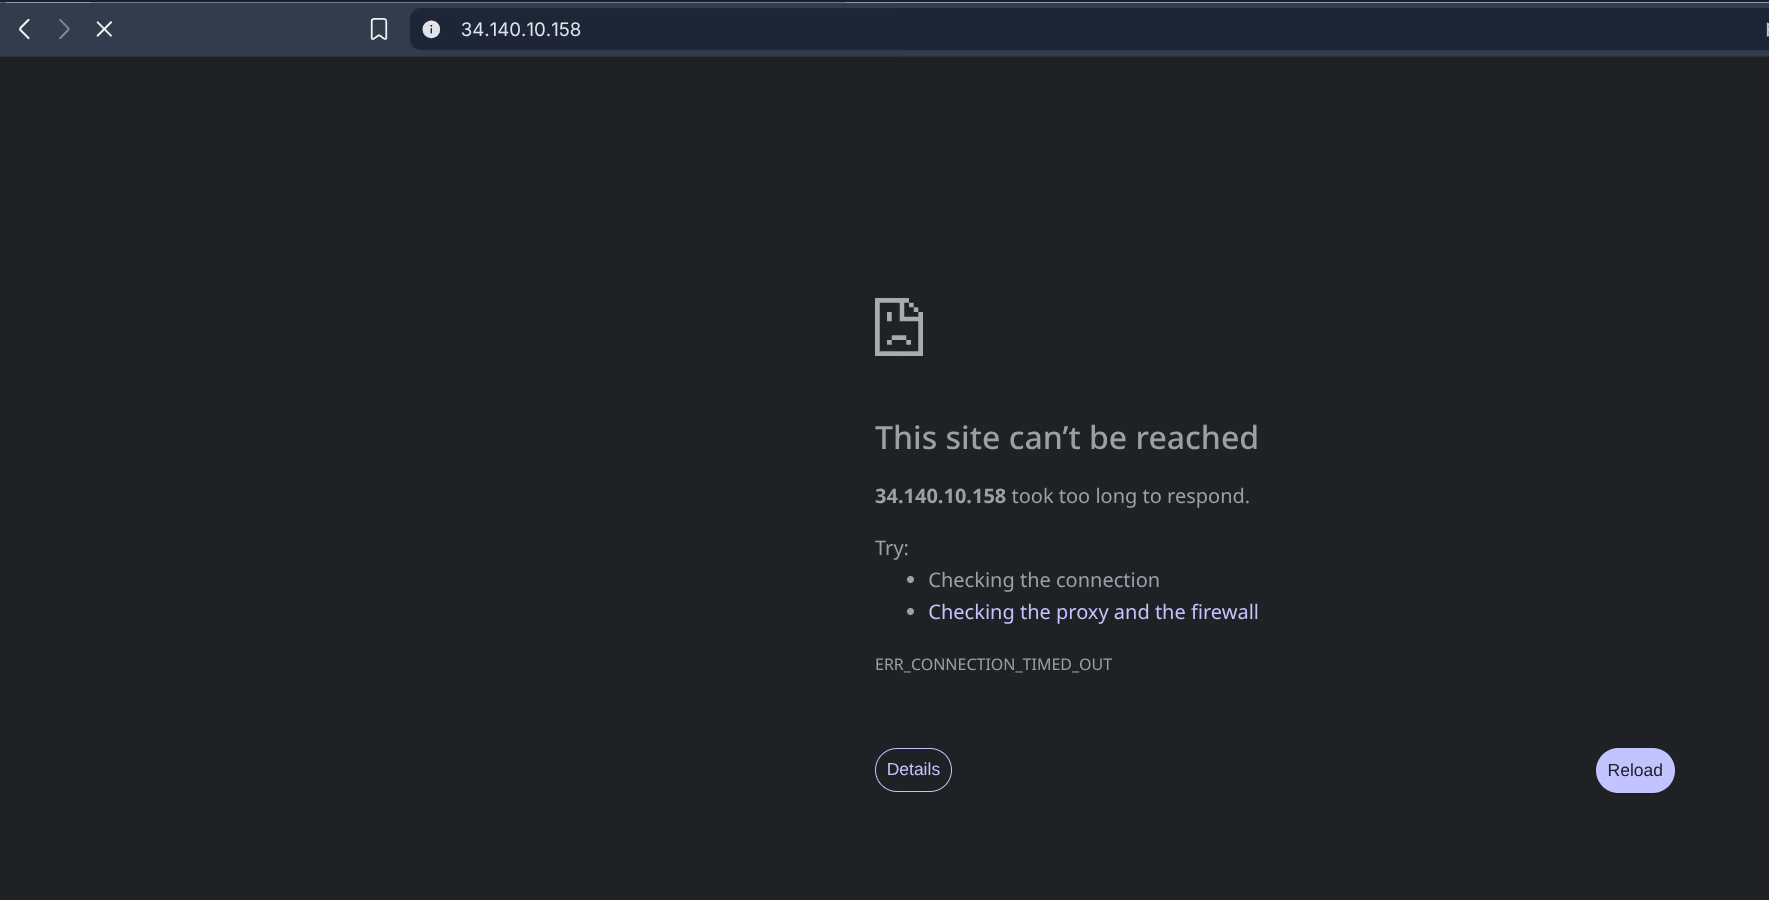
Tested without firewall rule first - blocked:
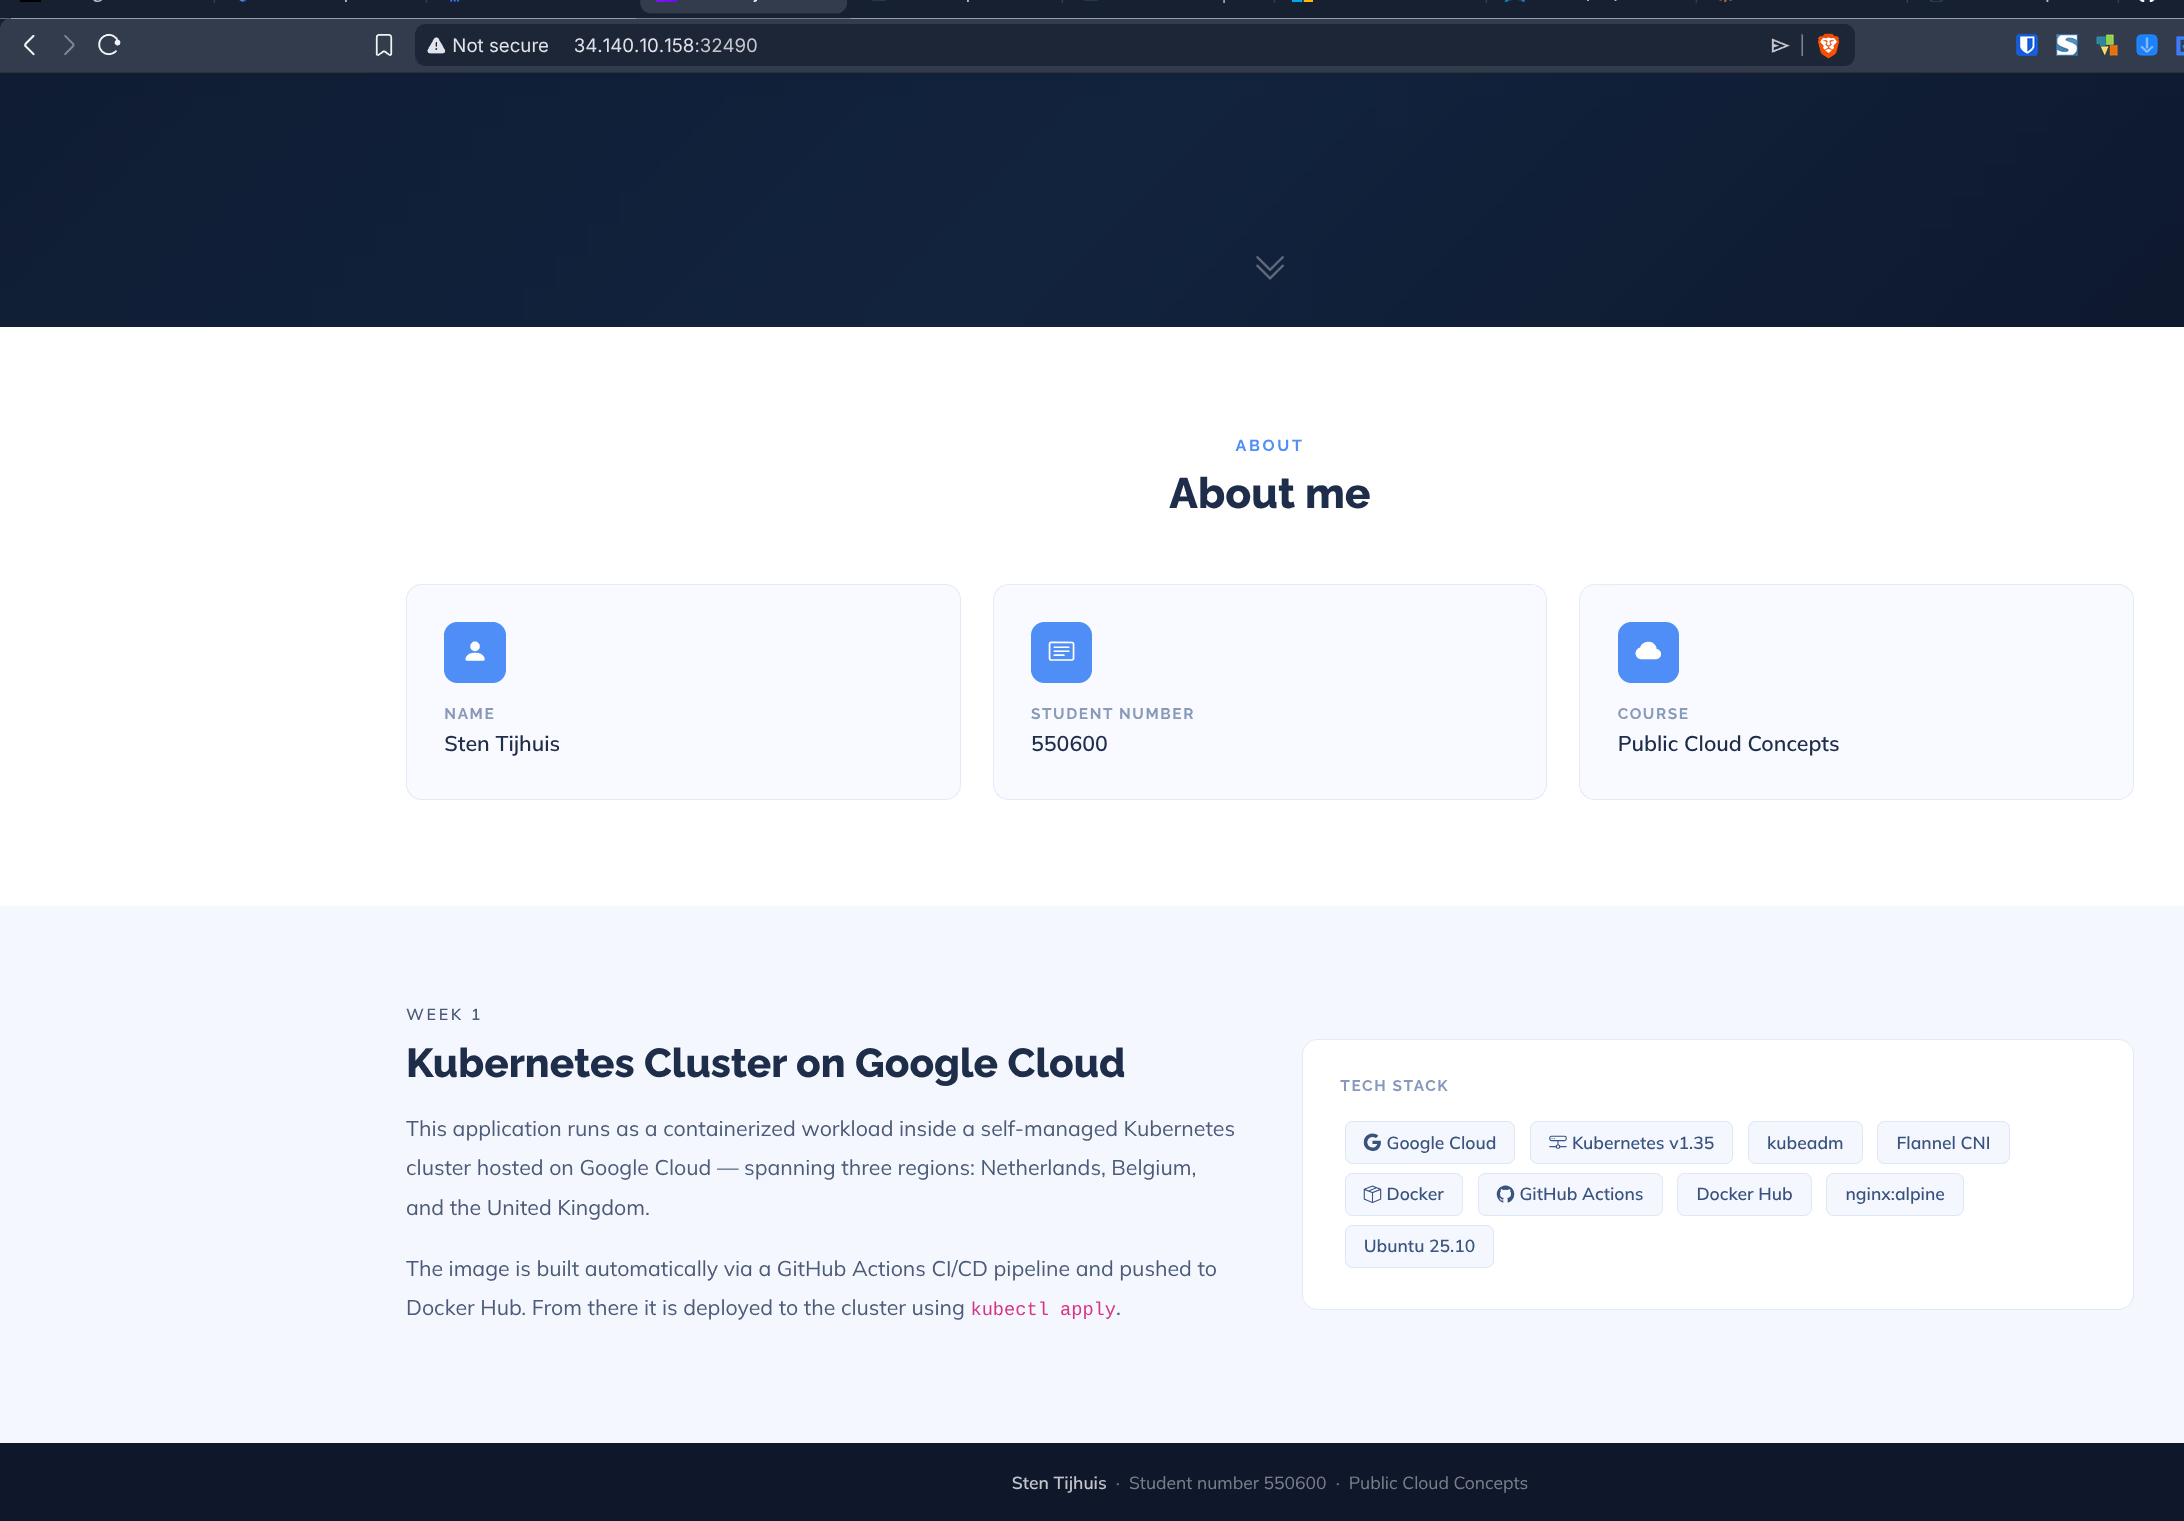
After creating the firewall rule, the site works:
kubectl port-forward is a developer tool for local testing, not an external access solution. The tunnel is only reachable on the machine running the command and stops when you press Ctrl+C.

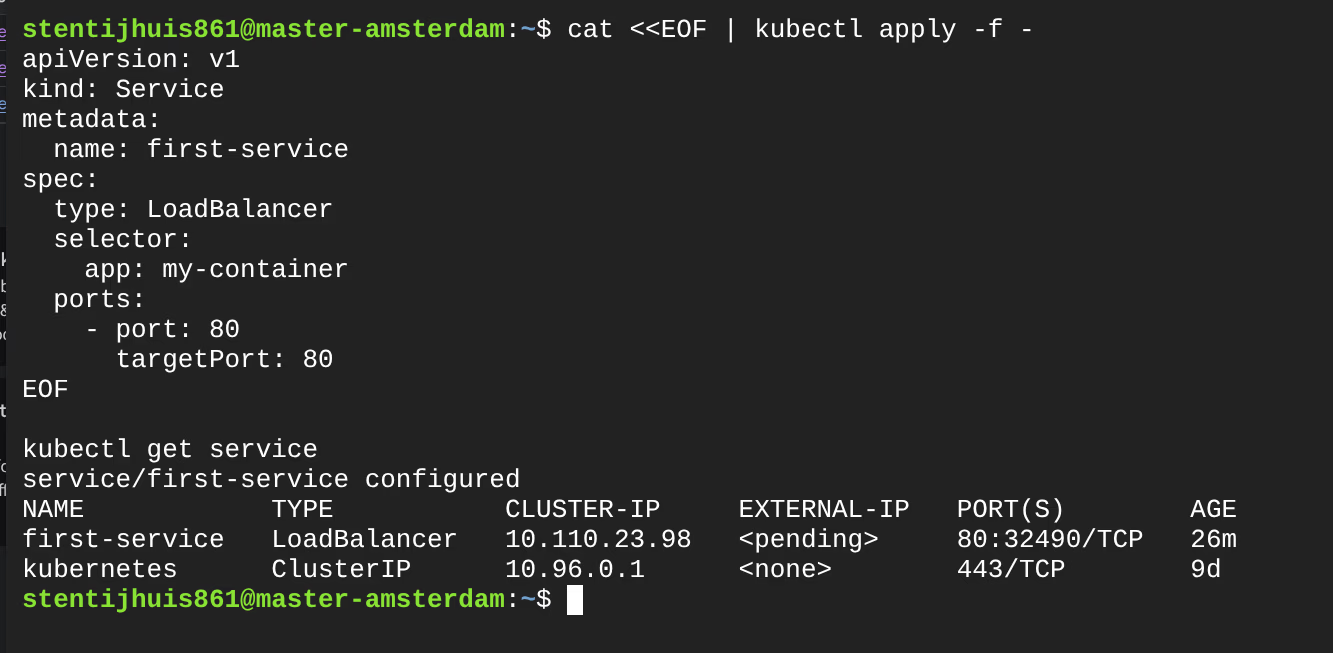
Assignment 2.2f - LoadBalancer on the kubeadm cluster
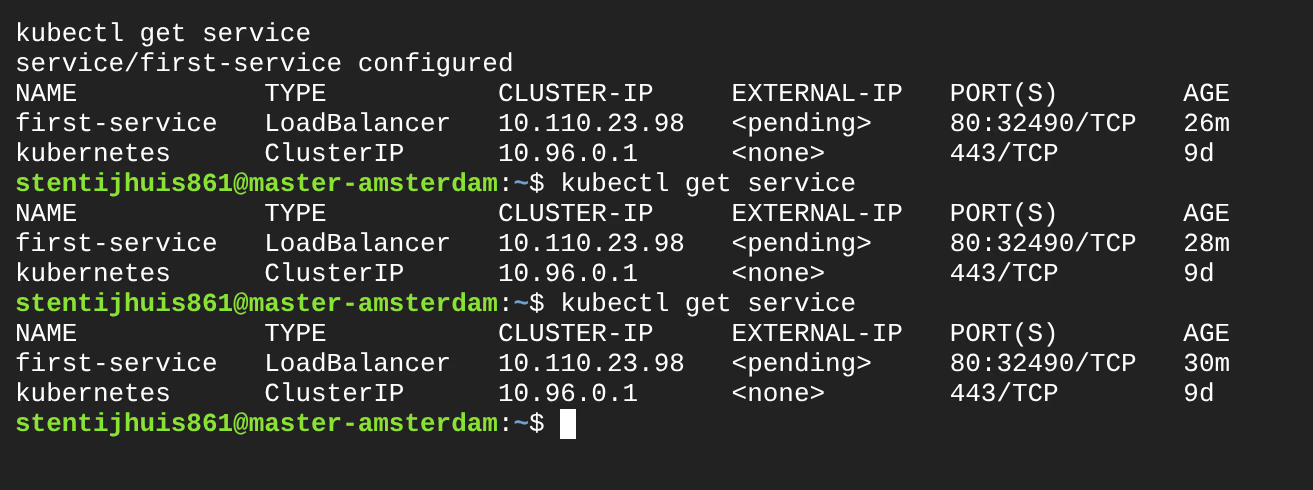
NAME            TYPE           CLUSTER-IP     EXTERNAL-IP   PORT(S)        AGE
first-service   LoadBalancer   10.110.23.98   <pending>     80:32490/TCP   26m
Why does it stay pending?
A LoadBalancer service asks the cloud controller manager to provision an external load balancer. On a self-managed kubeadm cluster there is no cloud controller manager present - there is no component that can request a GCP load balancer on behalf of Kubernetes. The external IP is never assigned.
| Approach | How | When |
|---|---|---|
| Proper way | GKE: cloud controller manager automatically provisions a Load Balancer | Production |
| NodePort + firewall rule | Manually open a GCP firewall rule for the NodePort | Workaround on kubeadm |
| Ingress controller | nginx Ingress Controller routes multiple services via a single external IP | Multiple apps (assignment 2.2h) |
Assignment 2.2g - LoadBalancer on GKE
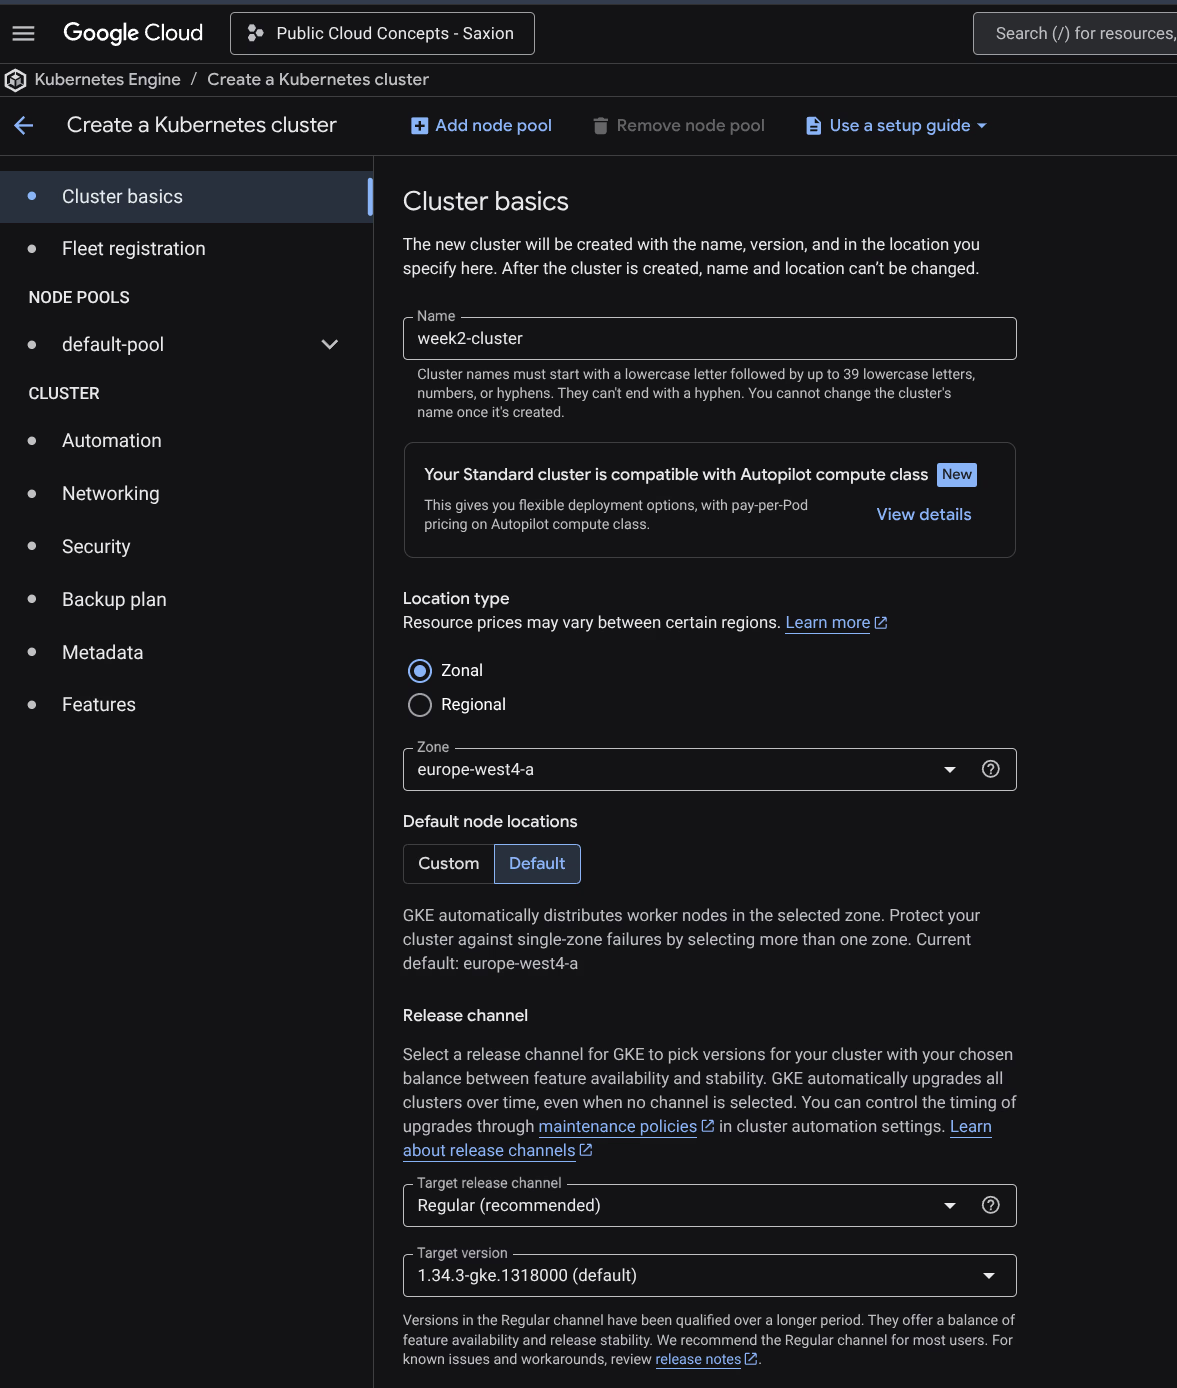
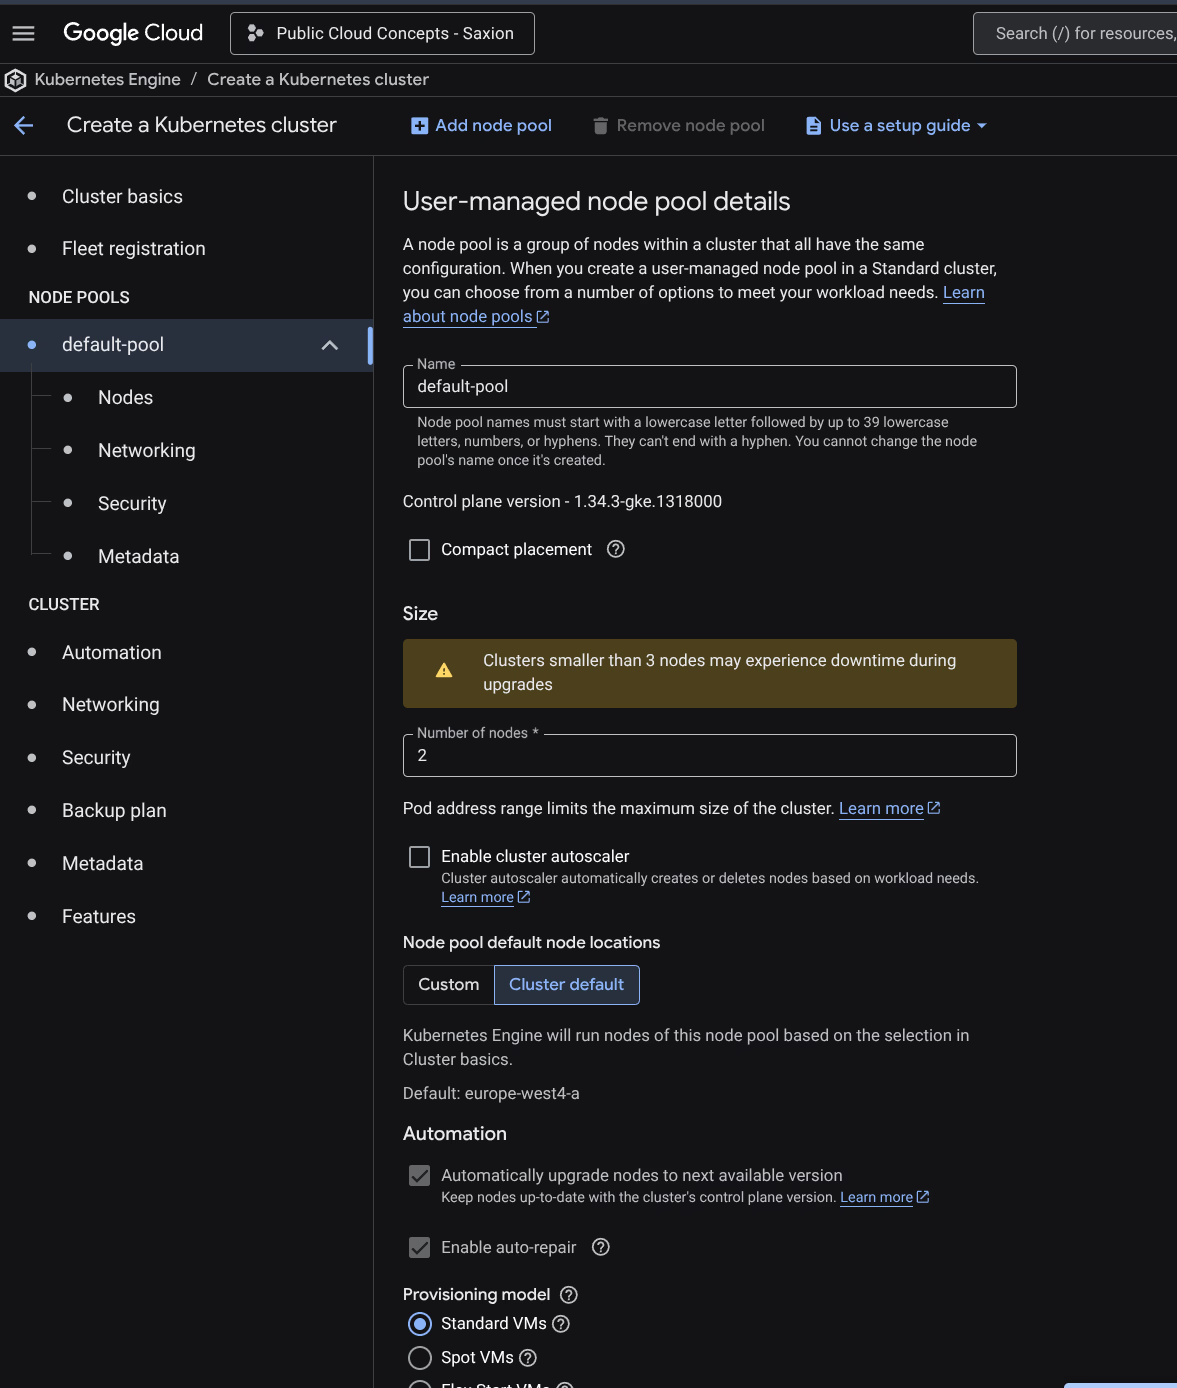
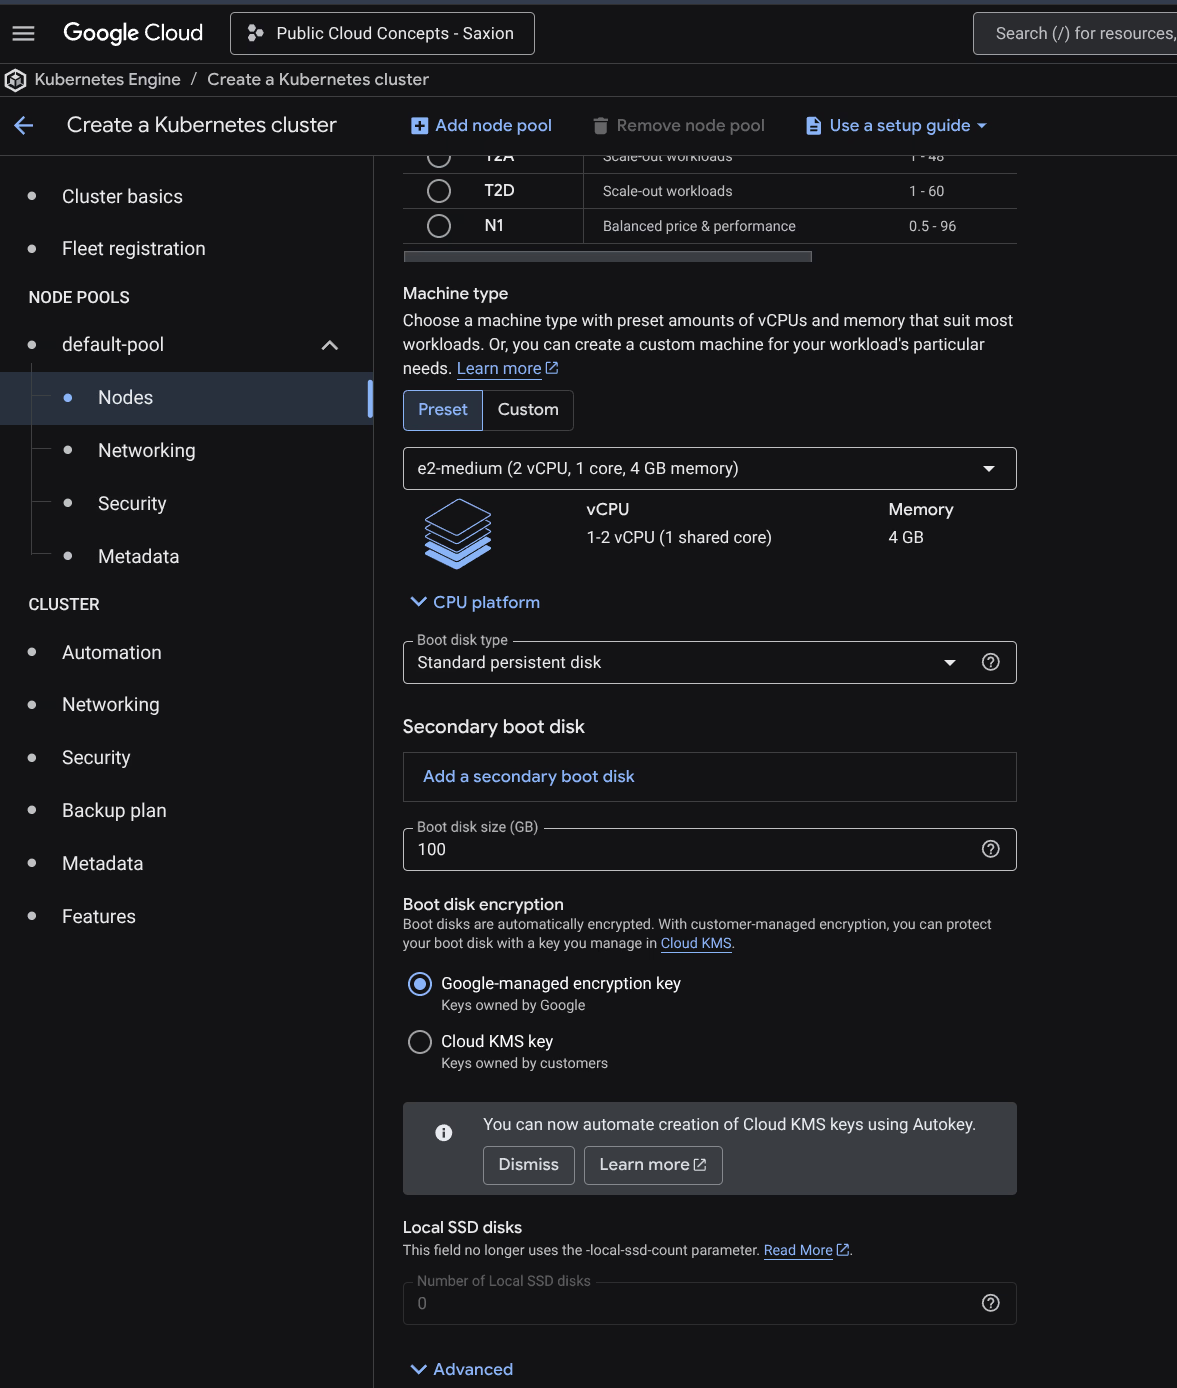
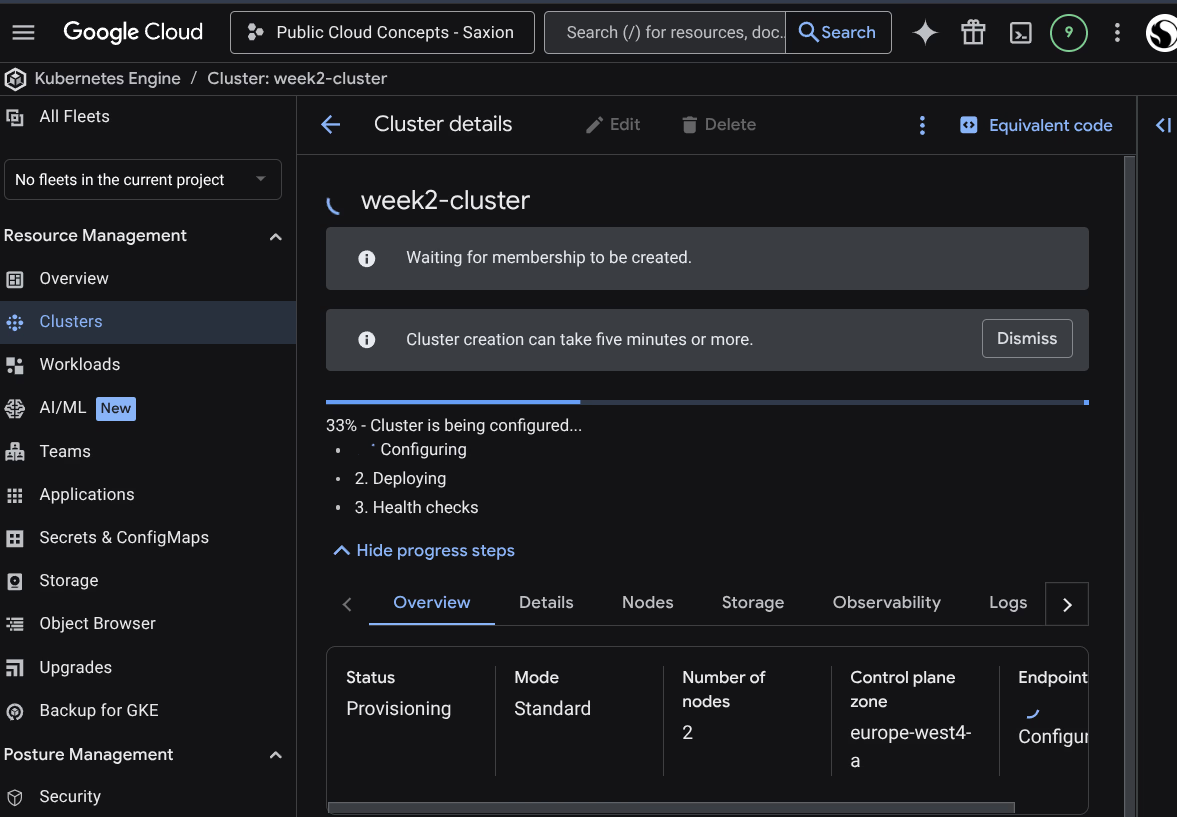
A GKE cluster week2-cluster was created: e2-medium, 2 nodes, europe-west4-a, Regular release channel.
gcloud container clusters get-credentials week2-cluster --zone europe-west4-a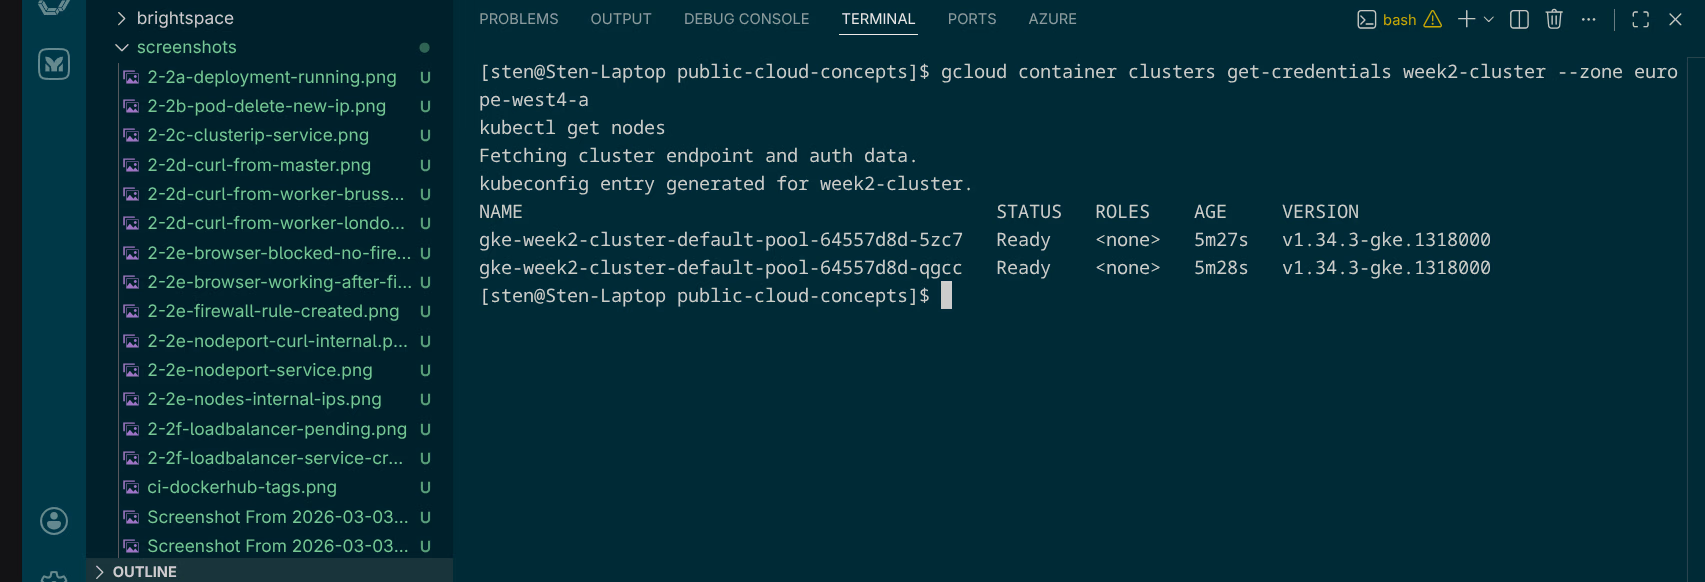
After deploying the deployment and service:
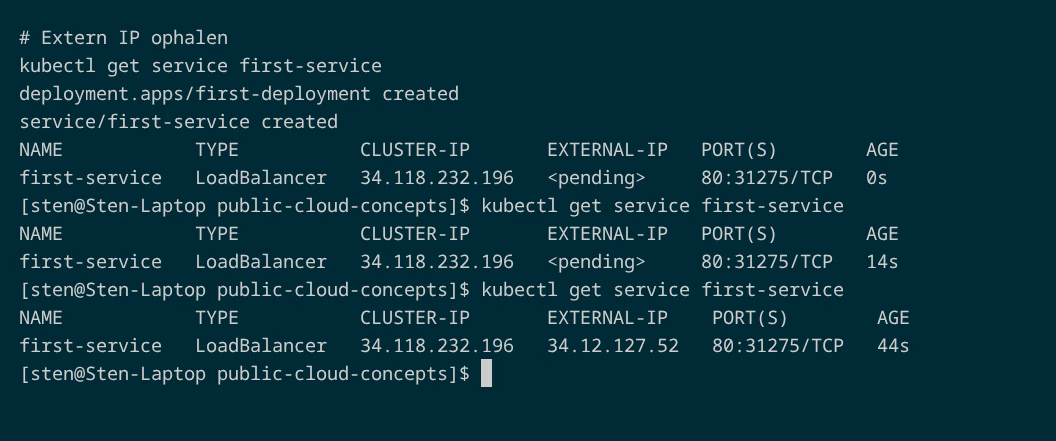
NAME            TYPE           CLUSTER-IP       EXTERNAL-IP     PORT(S)        AGE
first-service   LoadBalancer   34.118.232.196   34.12.127.52    80:31275/TCP   44s
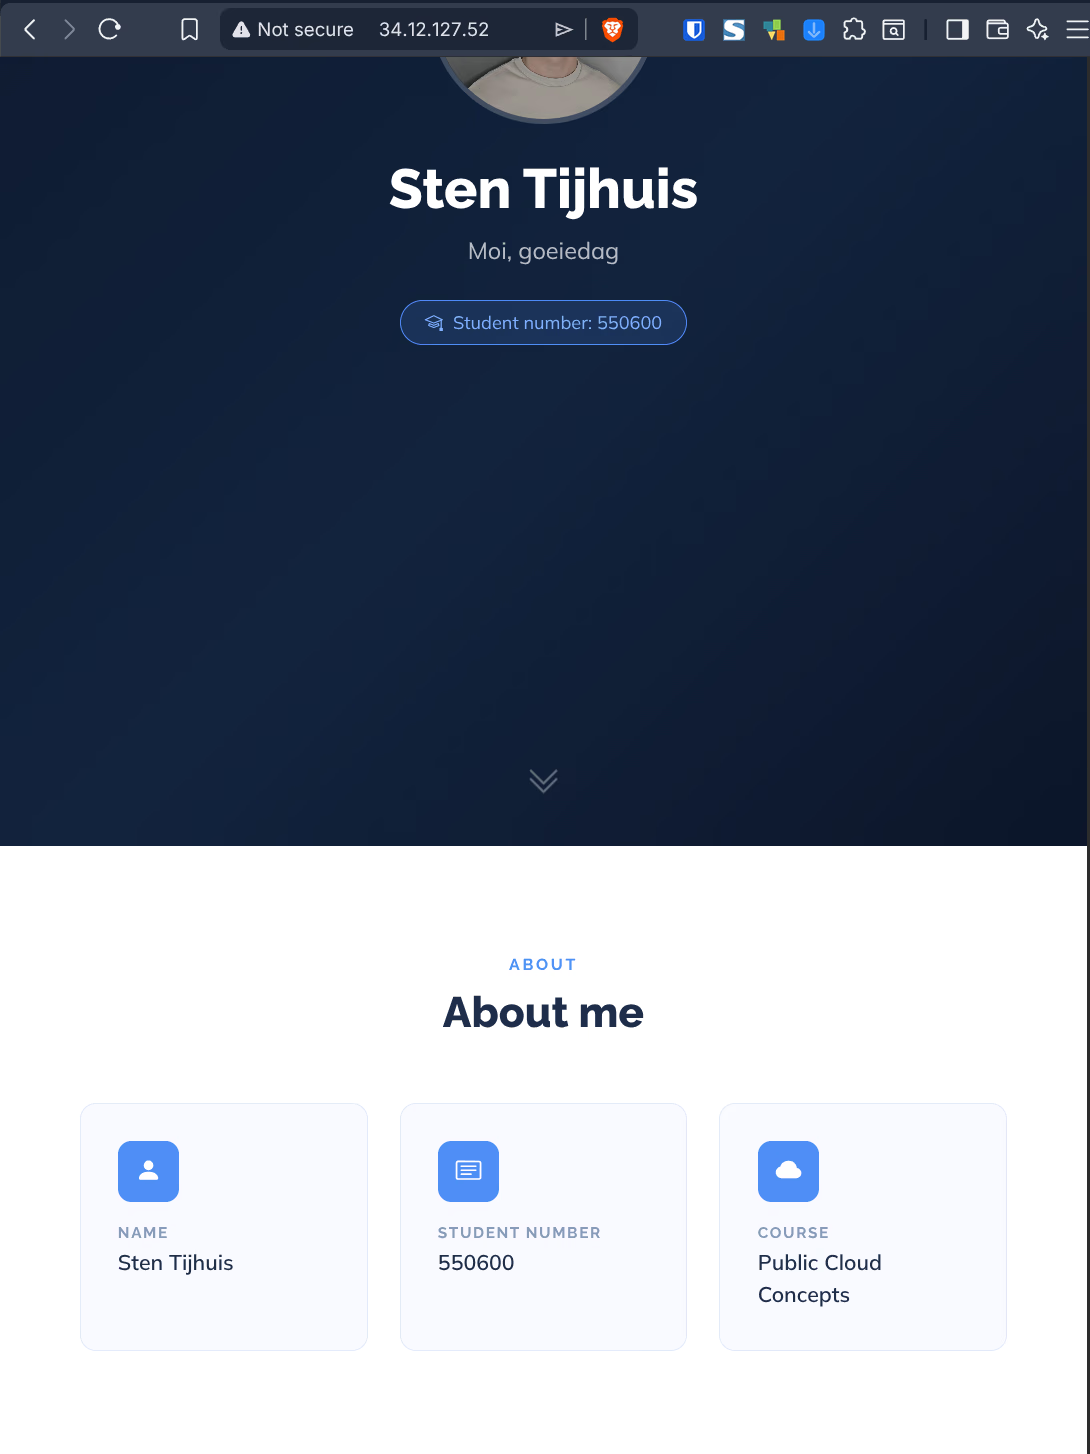
After ~44 seconds GKE had provisioned a Google Cloud Load Balancer and assigned the external IP 34.12.127.52. This is the core difference with the kubeadm cluster.
Assignment 2.2h - Ingress: multiple services via one load balancer
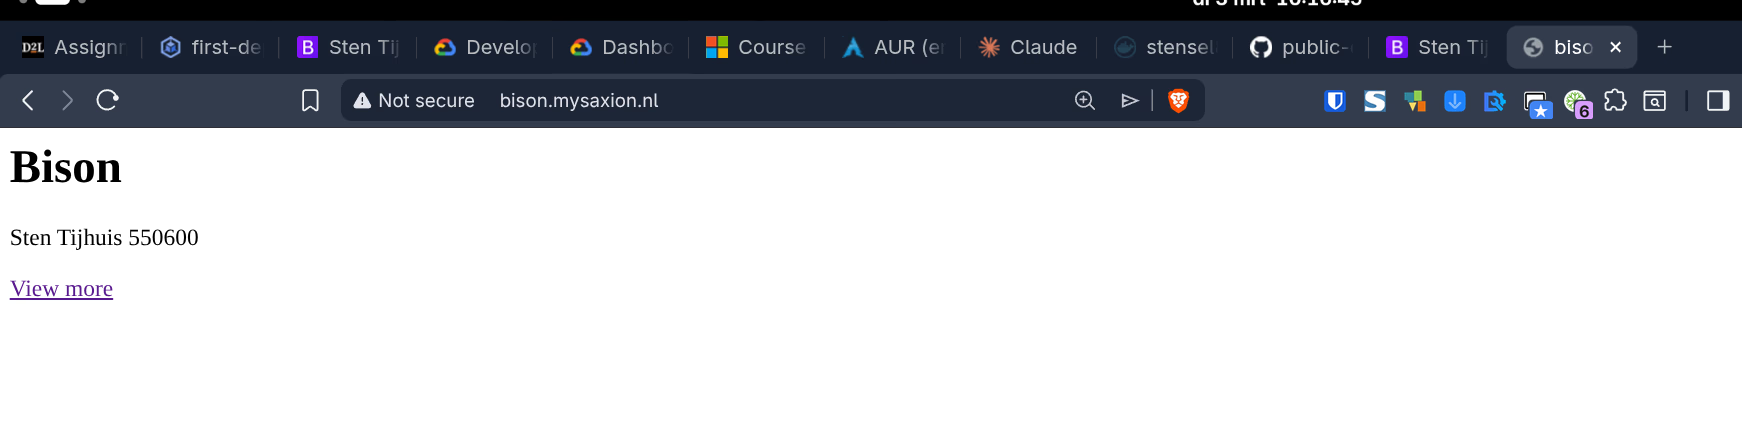
Two apps available via one Ingress, each on its own hostname:
| Hostname | Backend service |
|---|---|
bison.mysaxion.nl | bison-service (port 80) |
brightspace.mysaxion.nl | brightspace-service (port 80) |
Installing the nginx Ingress Controller:
kubectl apply -f https://raw.githubusercontent.com/kubernetes/ingress-nginx/controller-v1.12.0/deploy/static/provider/cloud/deploy.yaml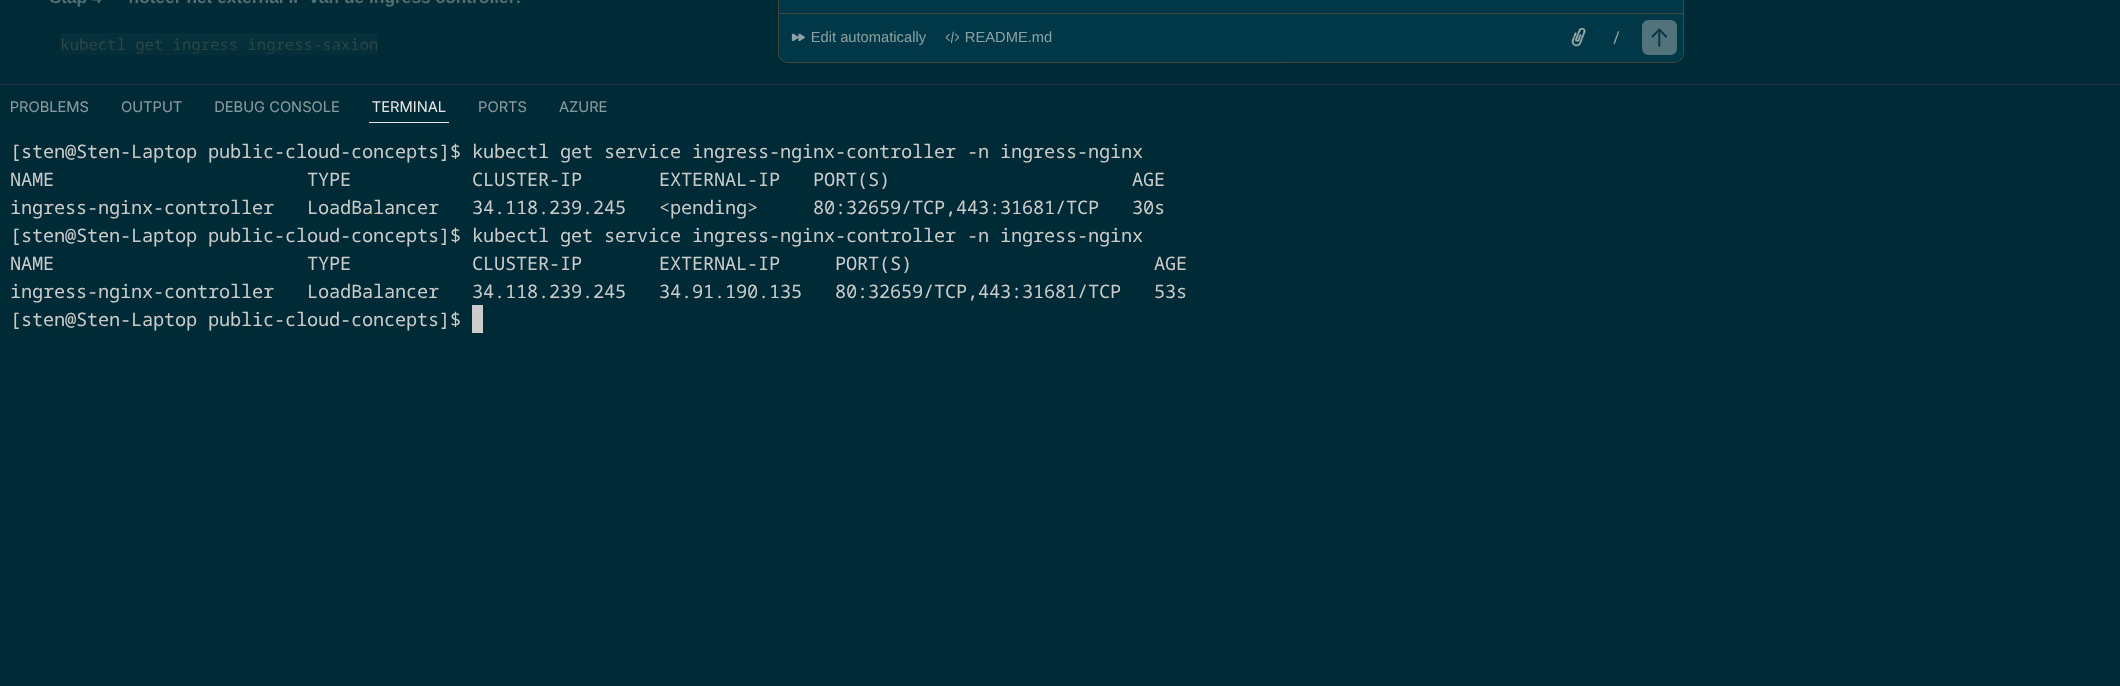
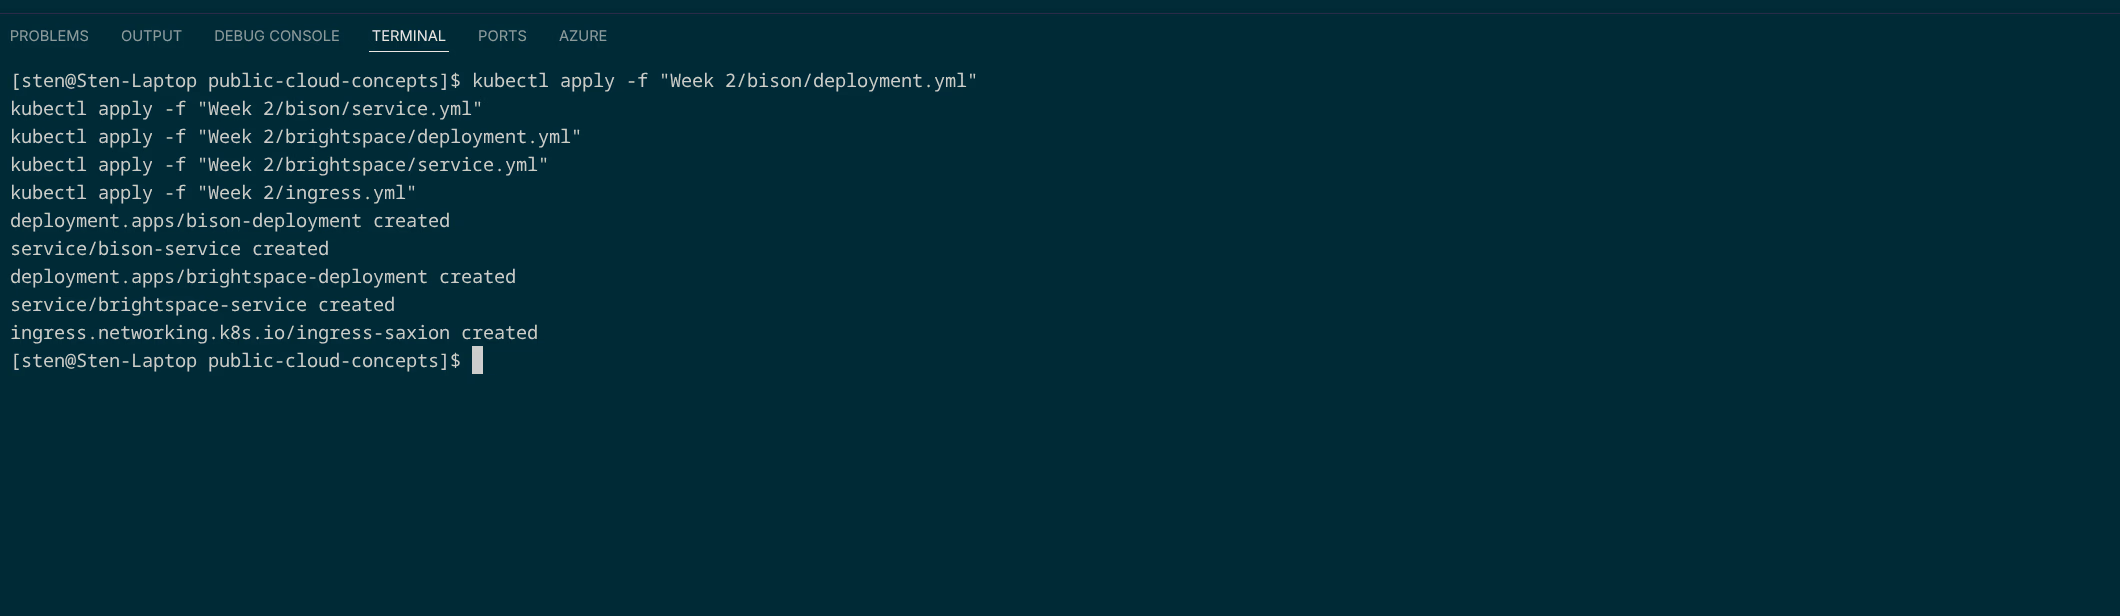
Deploying the manifests:
Applied files (see GitHub):
| File | Description |
|---|---|
| bison/deployment.yml | 2 replicas, image tag bison |
| bison/service.yml | ClusterIP on port 80 |
| brightspace/deployment.yml | 2 replicas, image tag brightspace |
| brightspace/service.yml | ClusterIP on port 80 |
| ingress.yml | Ingress based on Host HTTP header |
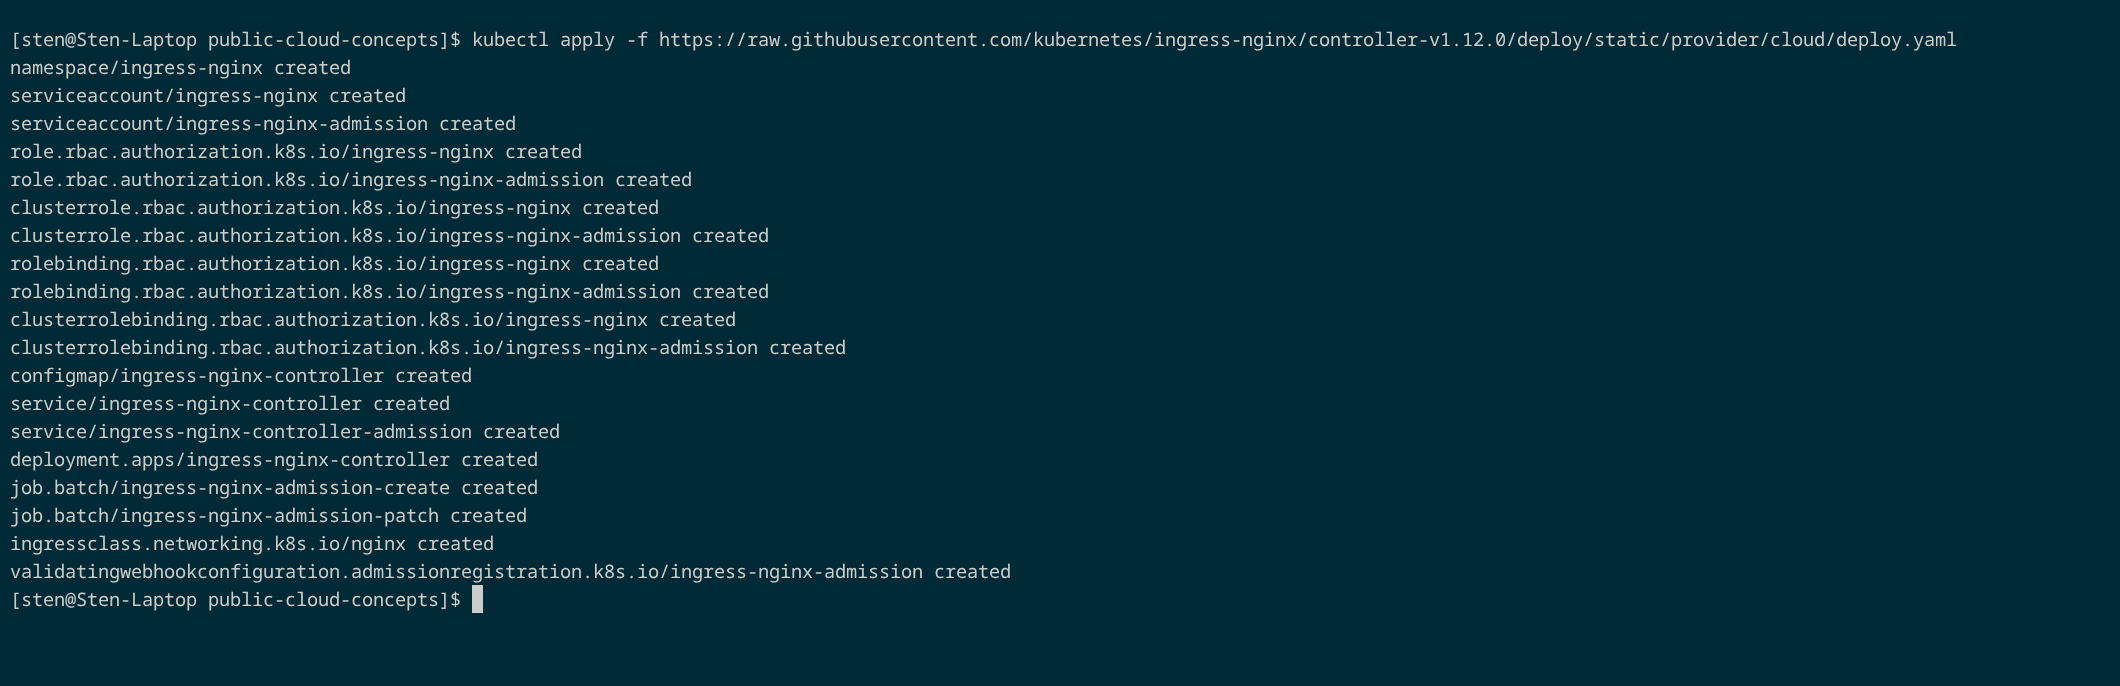
NAME             CLASS   HOSTS                                        ADDRESS          PORTS   AGE
ingress-saxion   nginx   bison.mysaxion.nl,brightspace.mysaxion.nl   34.91.190.135    80      25s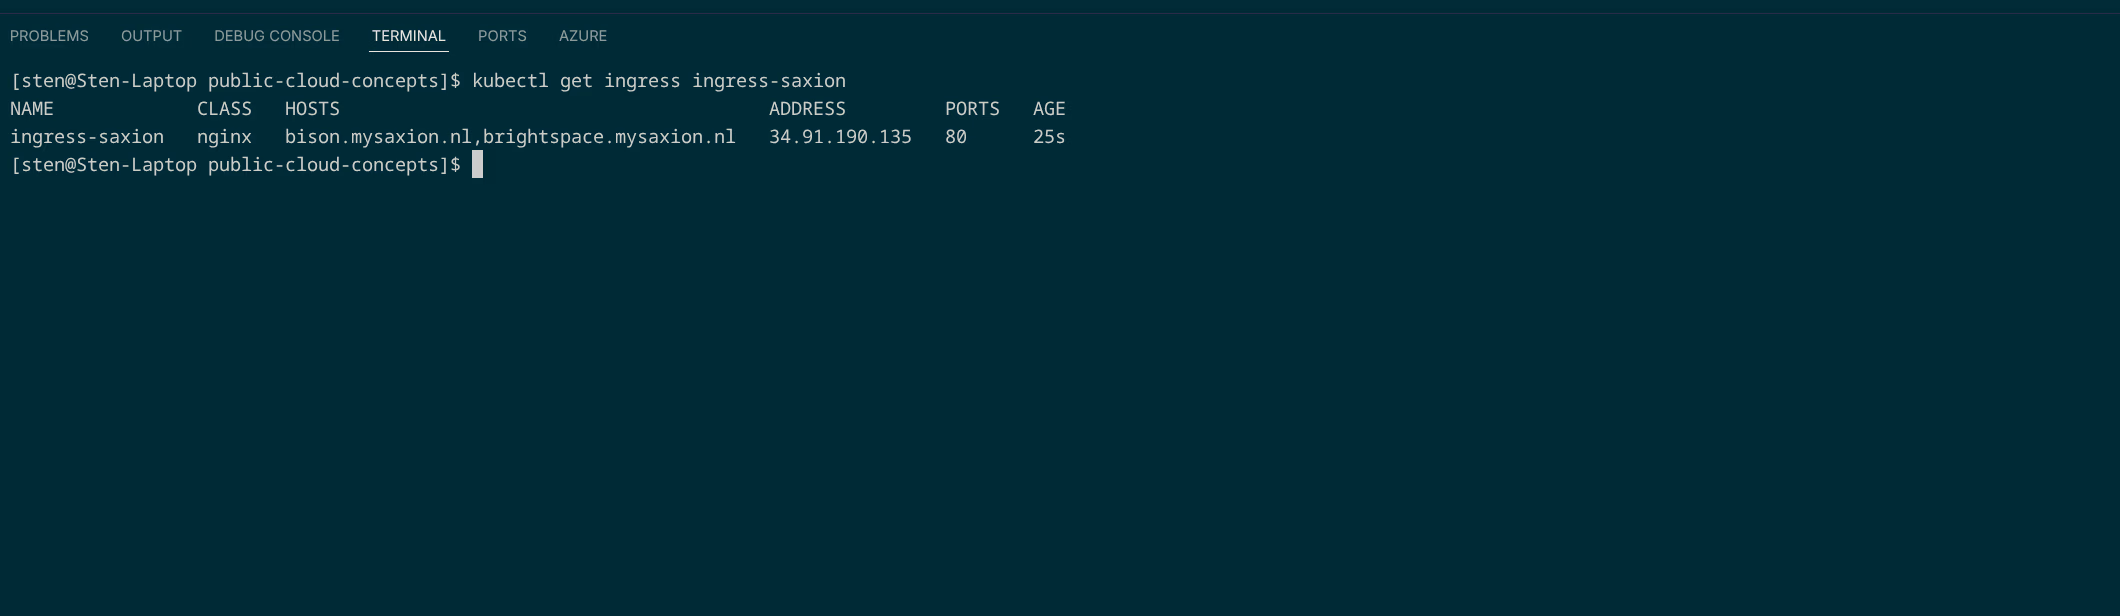
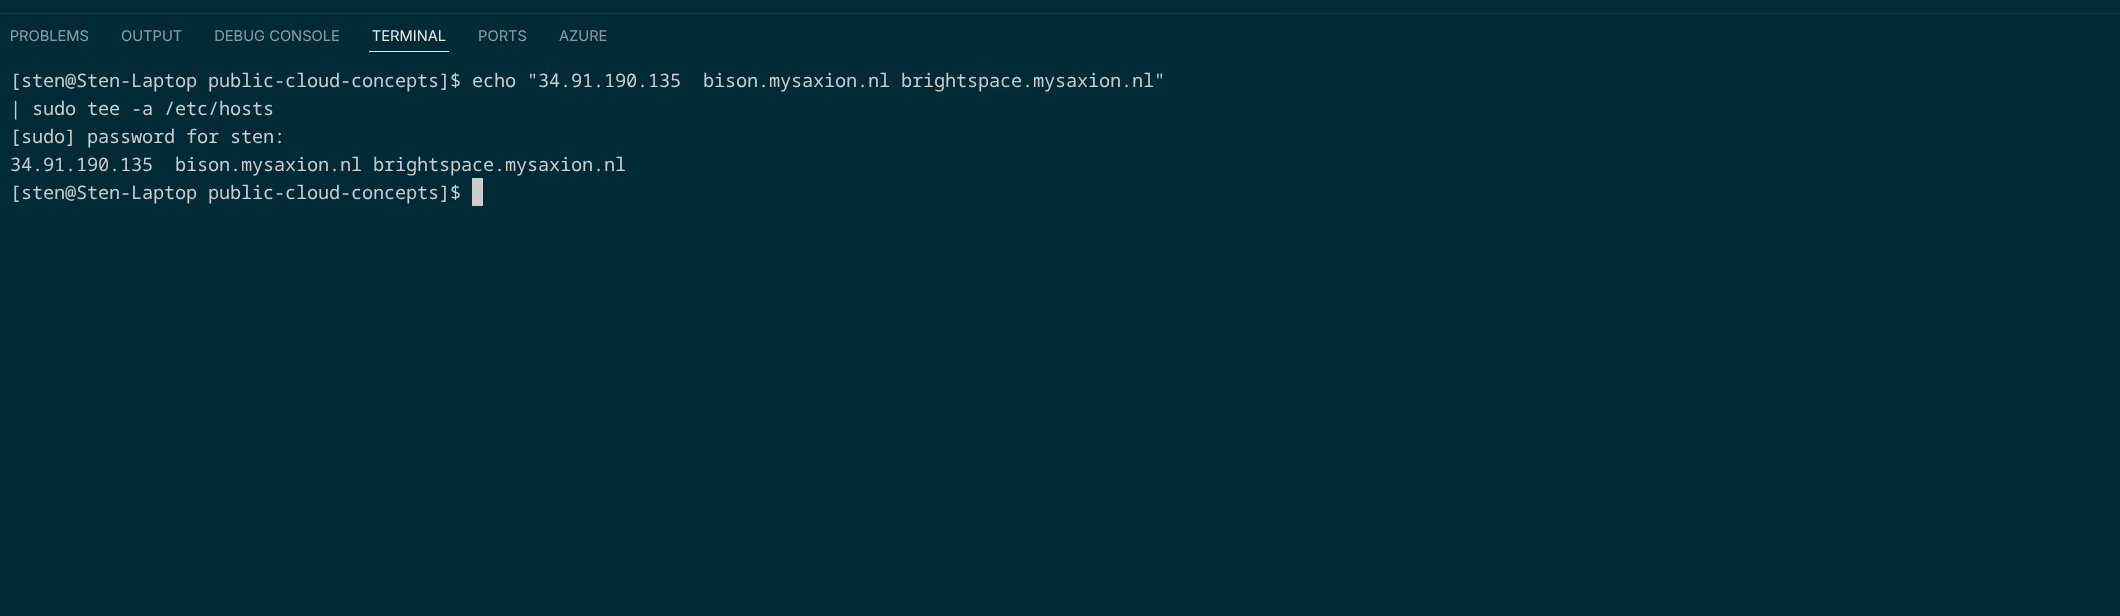
Hosts file updated:
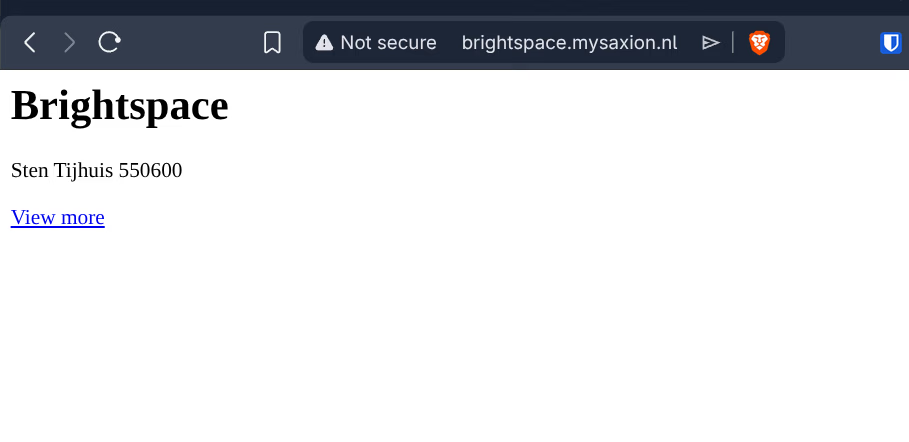
Why Ingress?
Without Ingress, each application needs its own LoadBalancer service (its own IP, its own cost). With Ingress, one load balancer routes traffic to the correct service based on the Host HTTP header.
2.3 DORA
DORA stands for DevOps Research and Assessment. It is a multi-year research project that looks at what successful software teams do differently from teams that struggle to deliver software well. Four measurable metrics came out of it.
What are the DORA metrics?
| Metric | What it measures |
|---|---|
| Deployment Frequency | How often do you successfully deploy to production? |
| Lead Time for Changes | How long does it take from a commit to going live? |
| Change Failure Rate | What percentage of your deploys go wrong? |
| Time to Restore Service | How quickly are you back up after an incident? |
Why do they matter?
Each metric says something about how you work. If you rarely deploy, that usually means your releases are large and risky. That makes every deploy tense, because a lot goes live at once.
A high Change Failure Rate points to something wrong with how you test or how your pipeline is set up. Teams that have this under control deploy small and often. When something does go wrong, it is found and fixed quickly.
DORA has also shown that this affects the team itself. Fewer big deploys means fewer fires, less crisis mode, and less stress.
How I apply this
| Technique | How I apply it |
|---|---|
| Continuous Integration | Every push automatically triggers a Dockerfile lint, image build, and Trivy scan. Errors are immediately visible, not only at a big release. |
| Trunk-Based Development | main is always deployable. development is used for new work that I test via the green slot before going live. |
| Deployment Automation | On every push to main the pipeline automatically deploys to both Docker Hub and Google Artifact Registry, and from there to GKE. No manual steps. |
| Monitoring and Observability | The monitoring stack from Week 5 keeps Time to Restore short: if something goes wrong I see it immediately in Grafana. |
The blue-green strategy fits in well here. Switching back is easy, so the threshold to go live is low. You always know you can roll back quickly if something is not right.