Solution


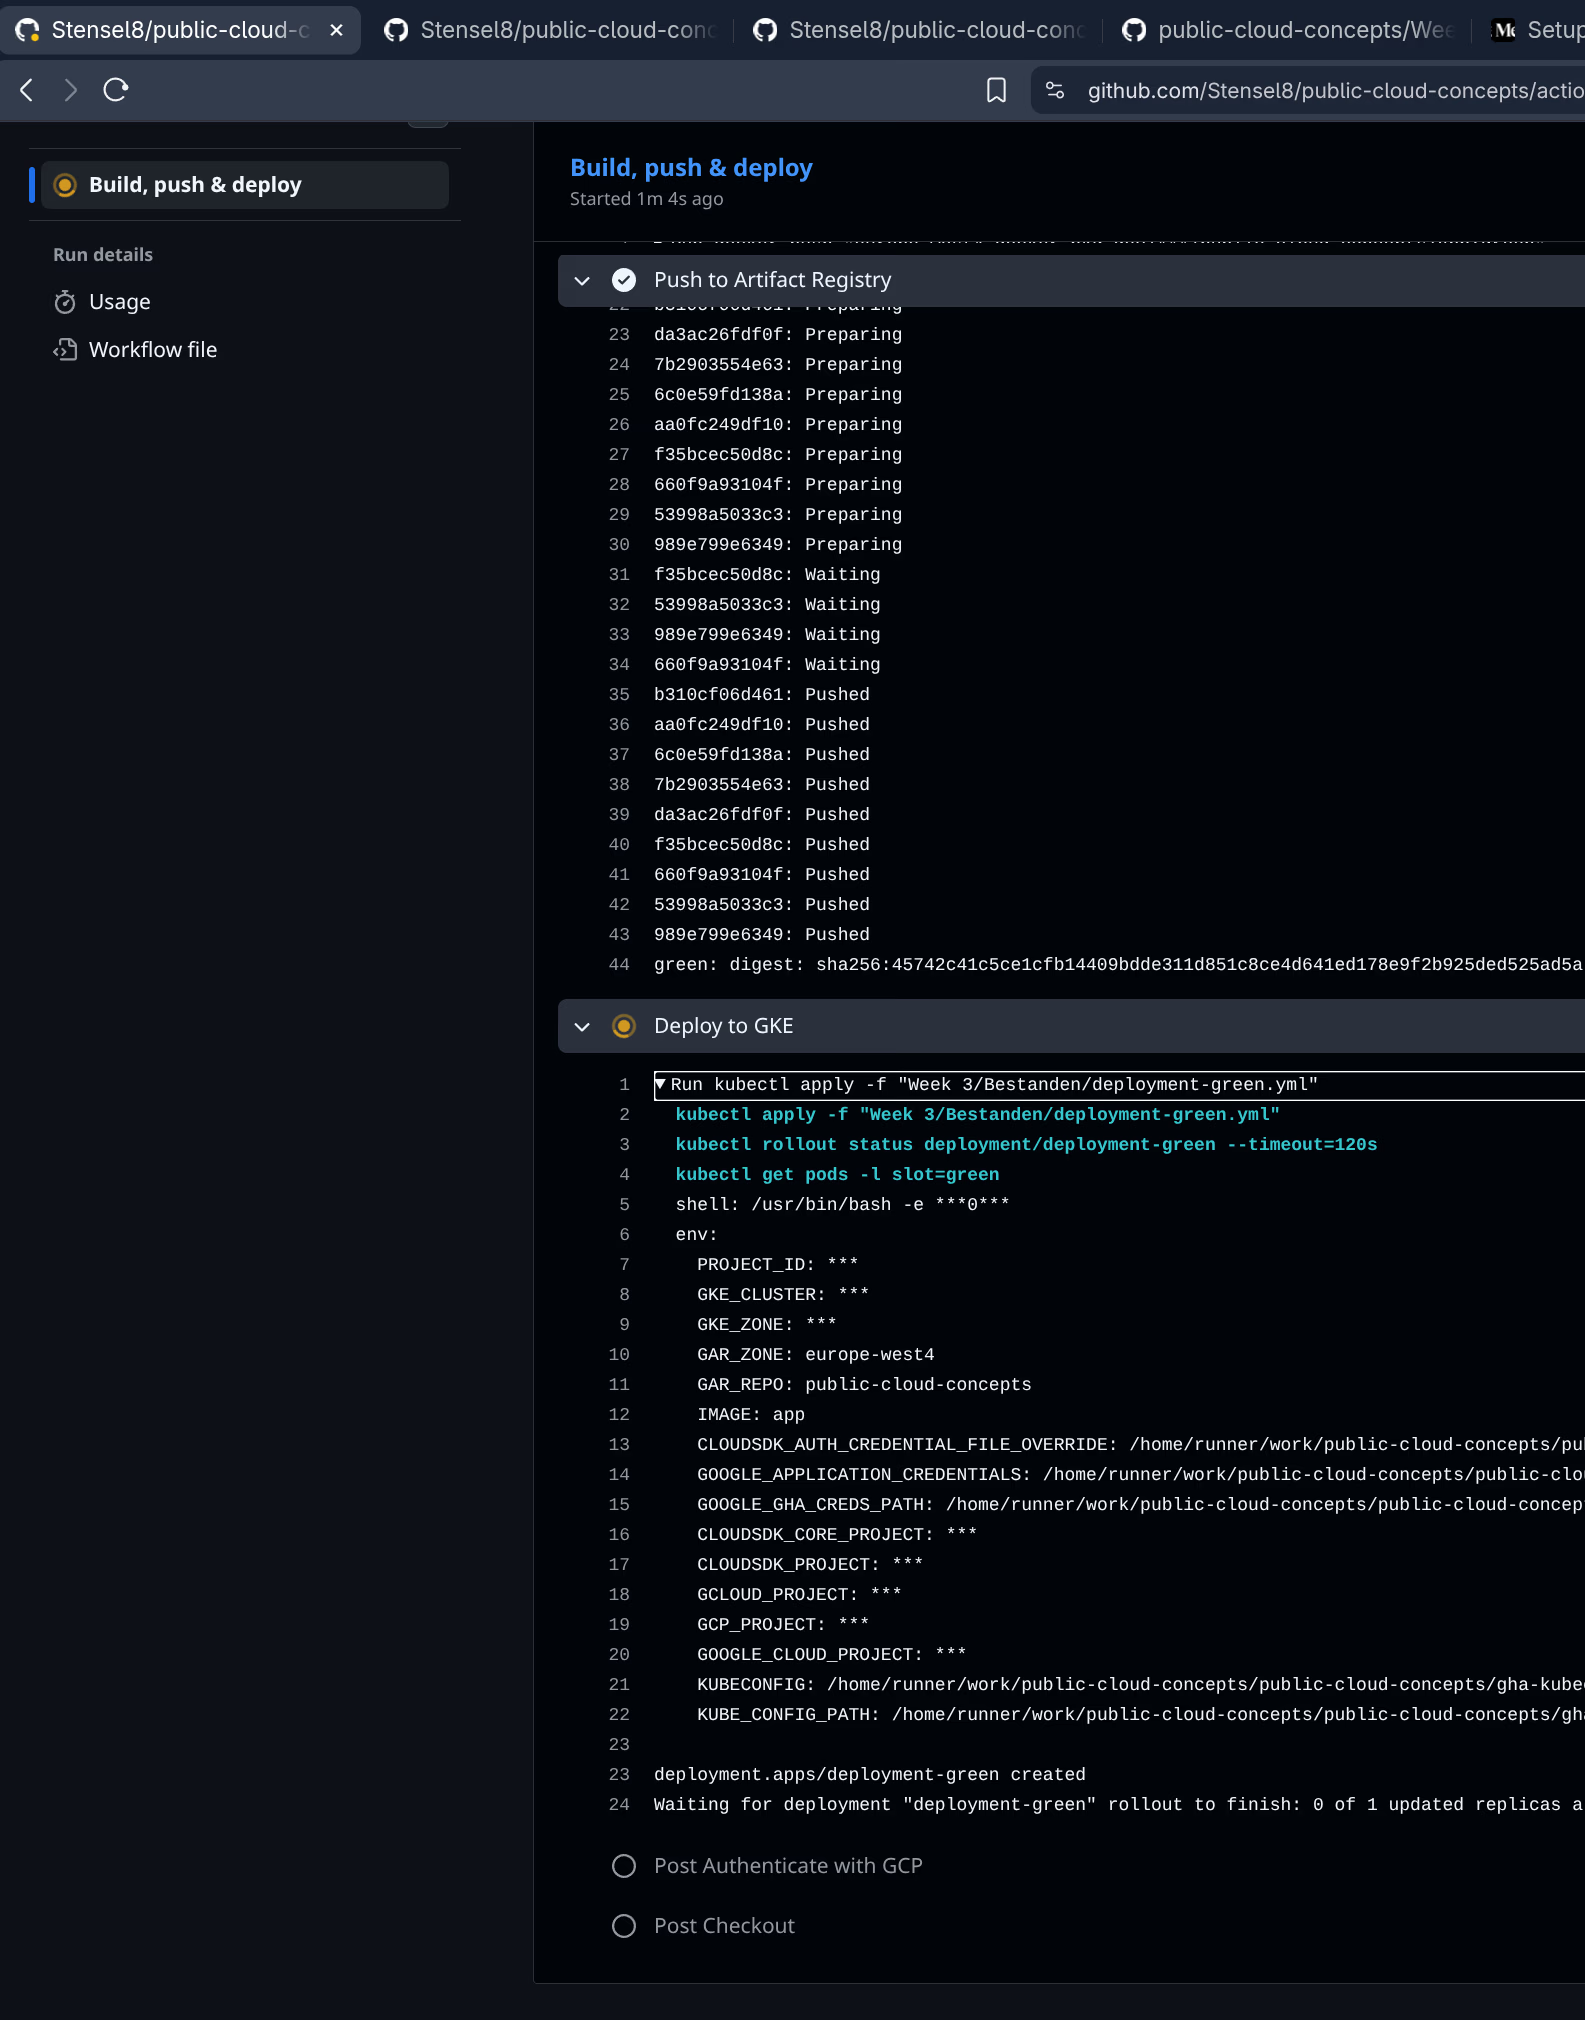
In week 3 I set up a Blue-Green deployment for the application from weeks 1 and 2, using Google Artifact Registry as the container registry instead of Docker Hub. I also set up a CI/CD pipeline with GitHub Actions.
Blue-Green strategy
selector in the Service.| Slot | Branch | Docker image tag | Status |
|---|---|---|---|
| Blue | main | blue | Production - receives live traffic |
| Green | development | green | Test - runs in parallel, receives no traffic |
How the pipeline works
- Push to
main: CI workflow builds the:blueimage and deploys todeployment-blue - Push to
development: CI workflow builds the:greenimage and deploys todeployment-green
Both deployments run at the same time. This makes it possible to develop new features on development, test them in the green slot, and then switch via the switch-slot workflow.
Switching between slots
The switch-slot workflow is a manual workflow (workflow_dispatch) that is started via GitHub Actions. When starting it I choose blue or green, after which the Service selector is updated with:
kubectl patch service public-cloud-concepts \
  -p '{"spec":{"selector":{"slot":"<blue|green>"}}}'
The pipeline uses kubectl apply so the Service is also created if it does not exist yet. After the switch the pipeline verifies the active slot and shows the running pods.
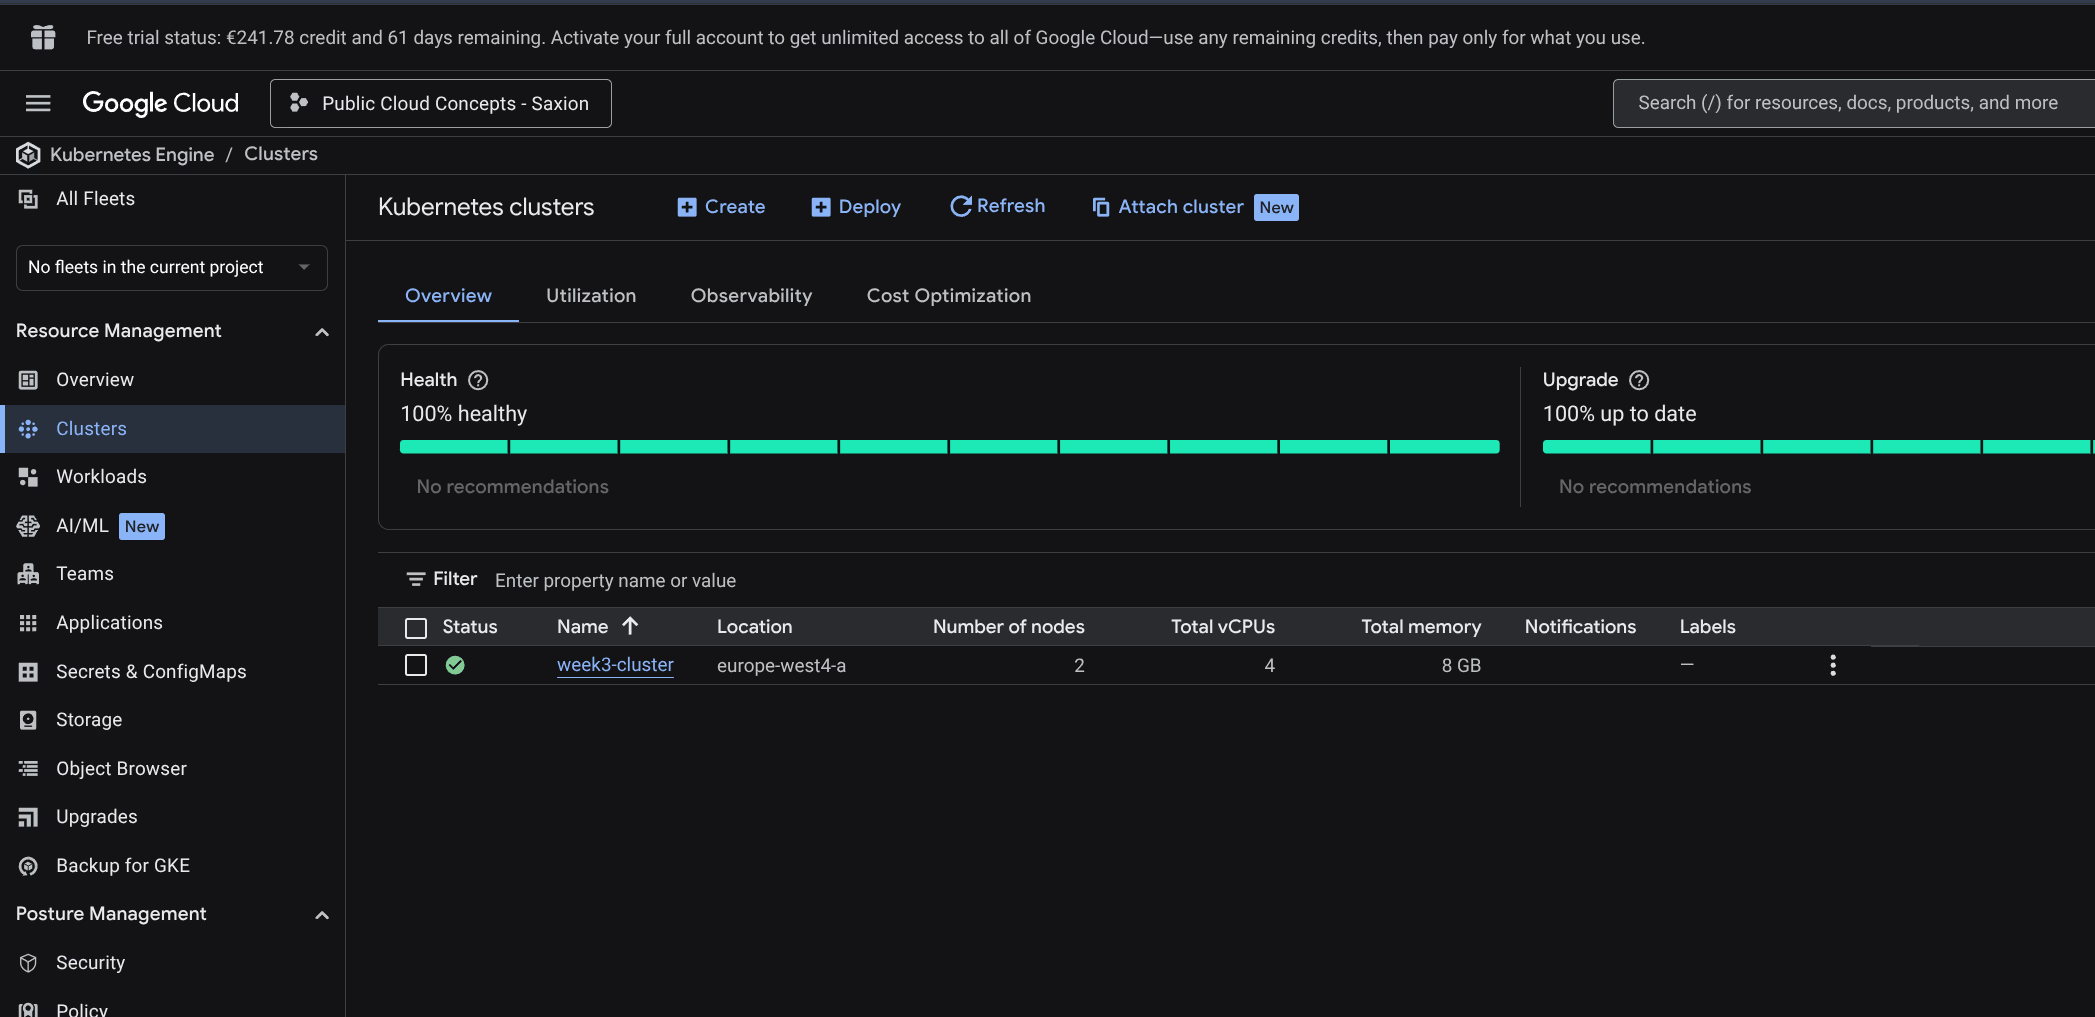
Step 1: Create Kubernetes cluster
As a base I use the Week 2 environment: a GKE cluster, set up again as week3-cluster. Standard cluster, 2 nodes, e2-medium (2 vCPU, 4 GB RAM), europe-west4-a.
gcloud container clusters get-credentials week3-cluster \
  --region europe-west4-a \
  --project project-5b8c5498-4fe2-42b9-bc3
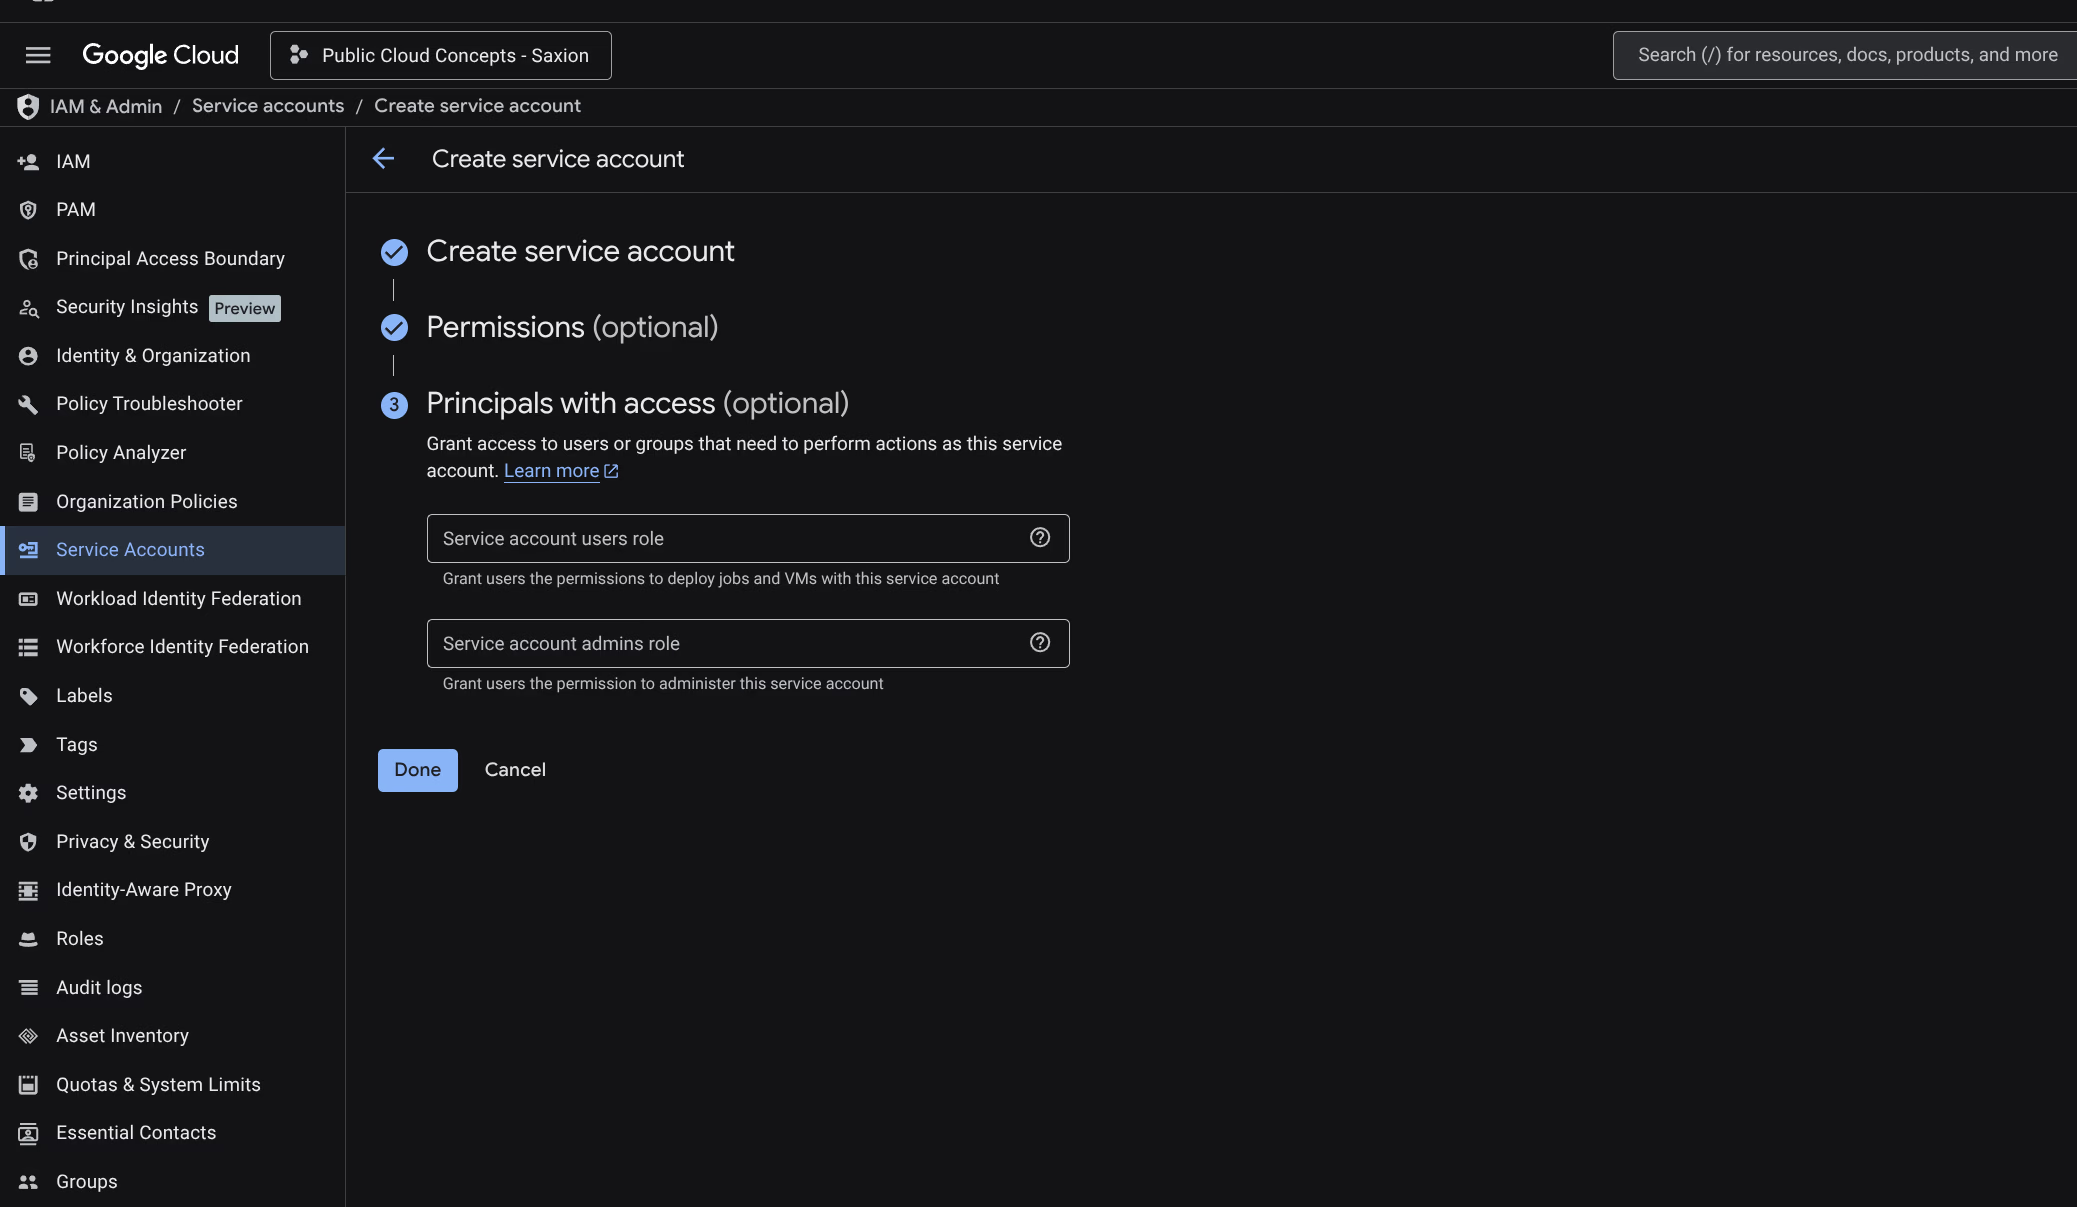
Step 2: Create Service Account
A Service Account for GitHub Actions to communicate with GCP:
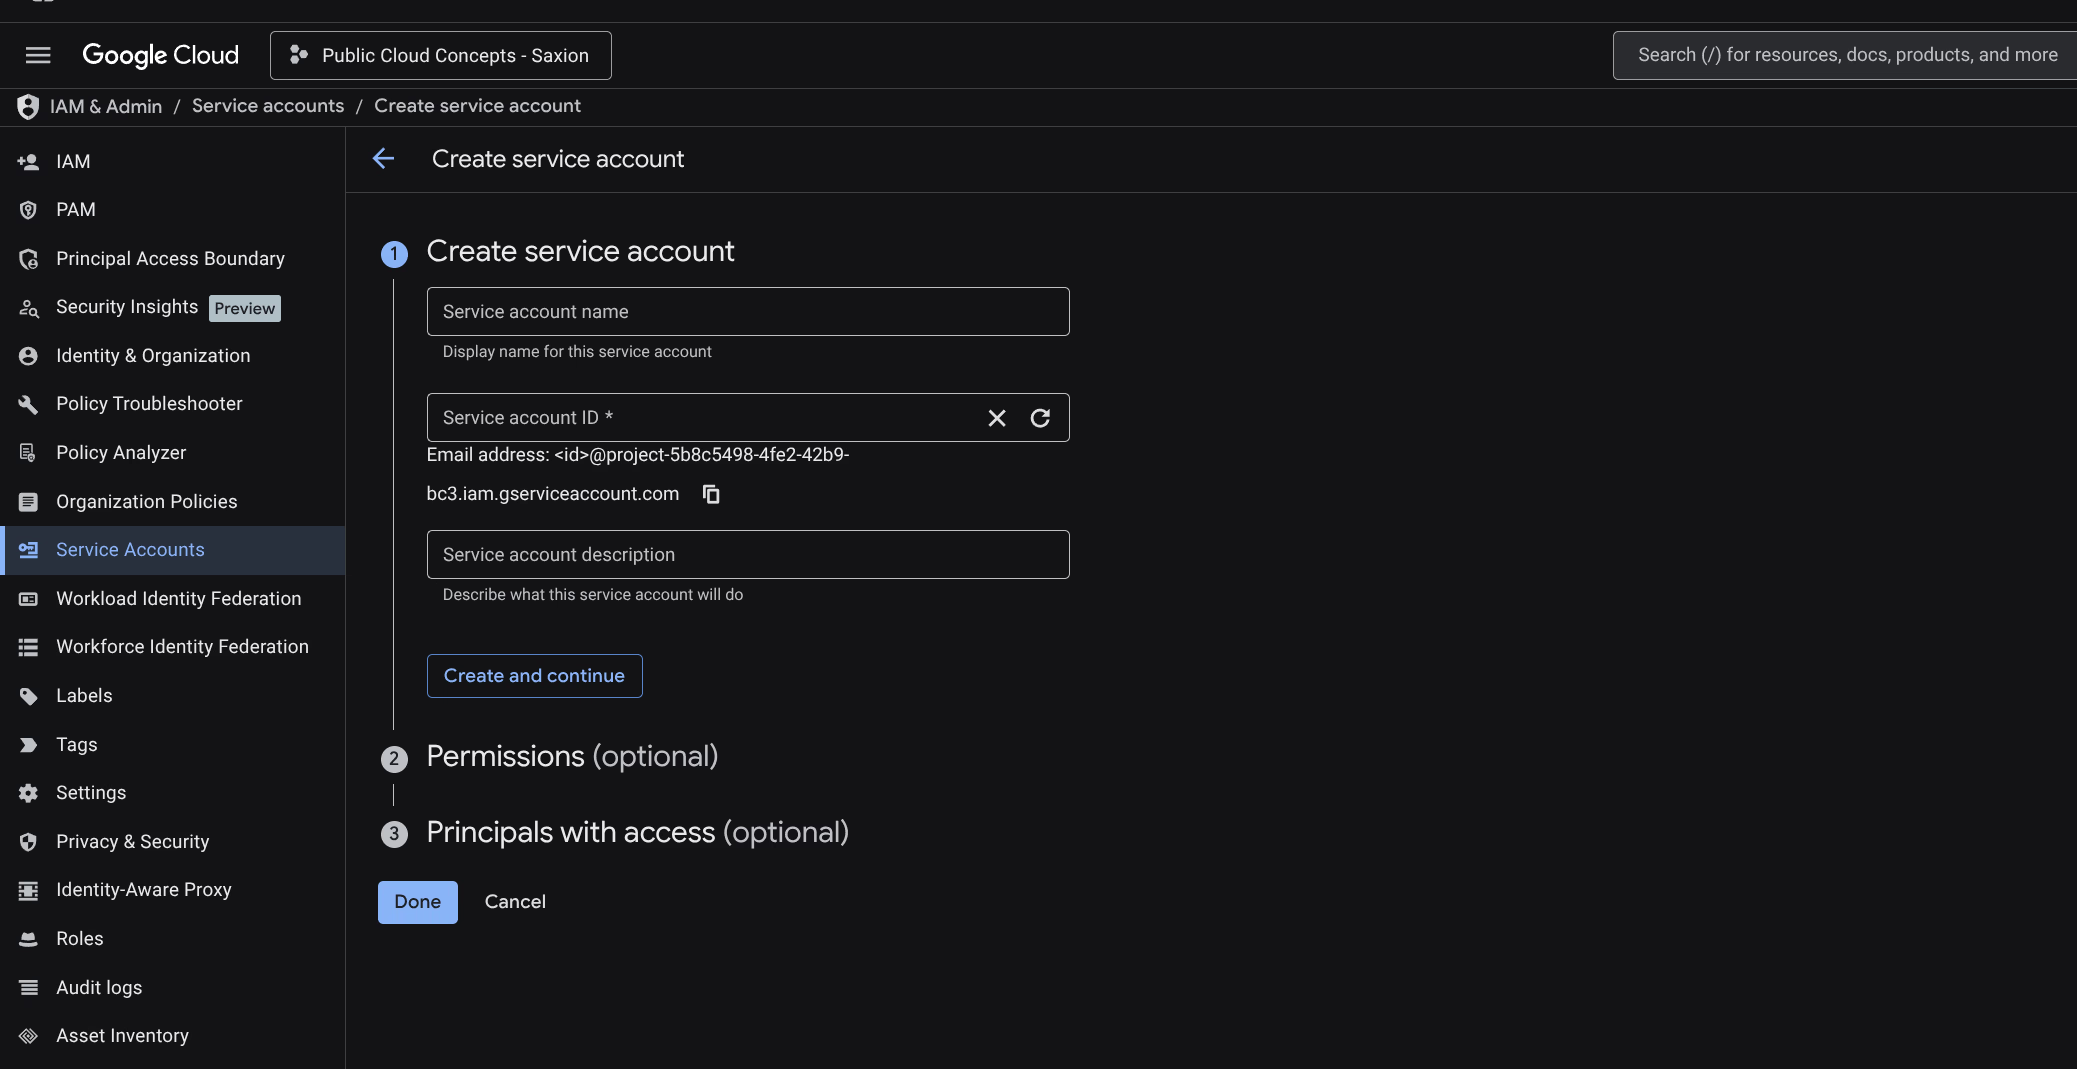
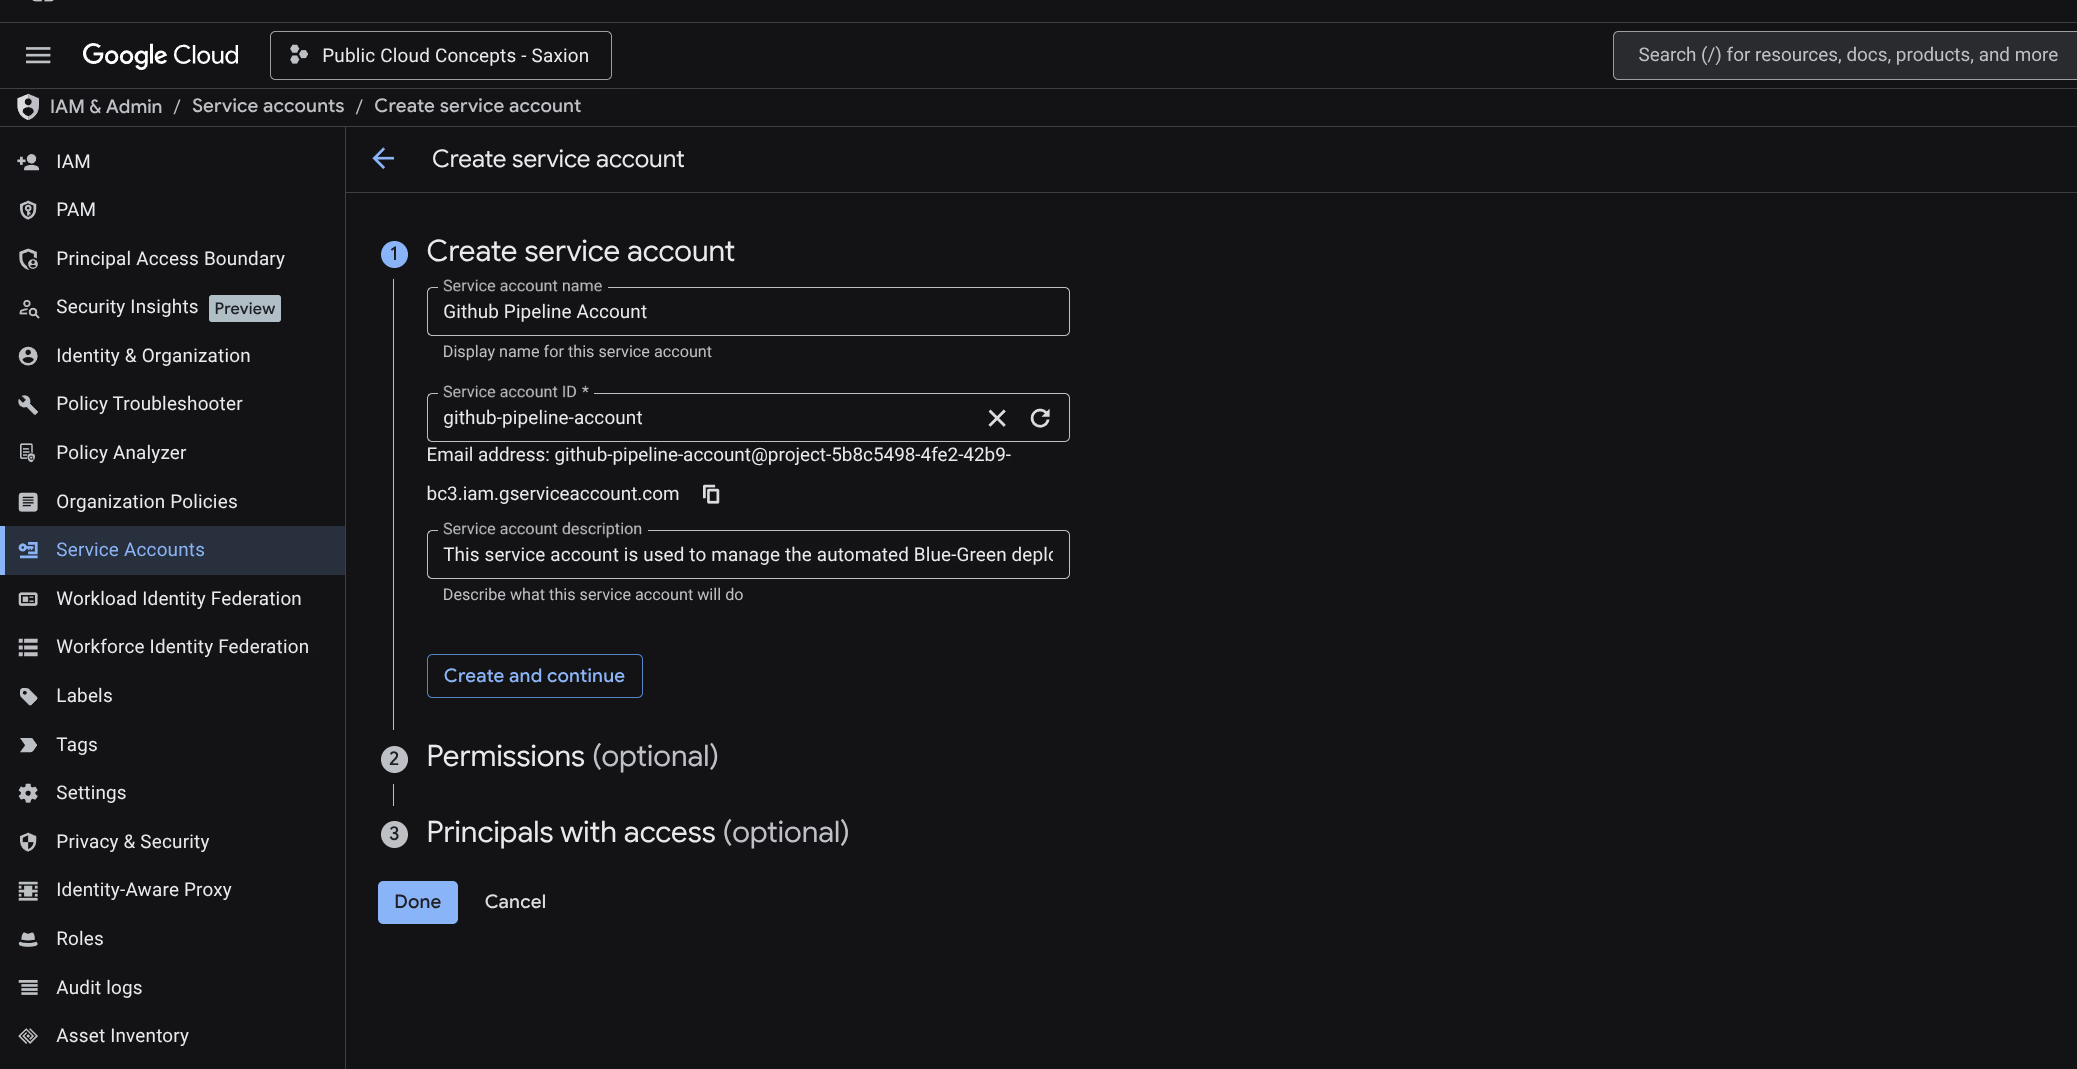
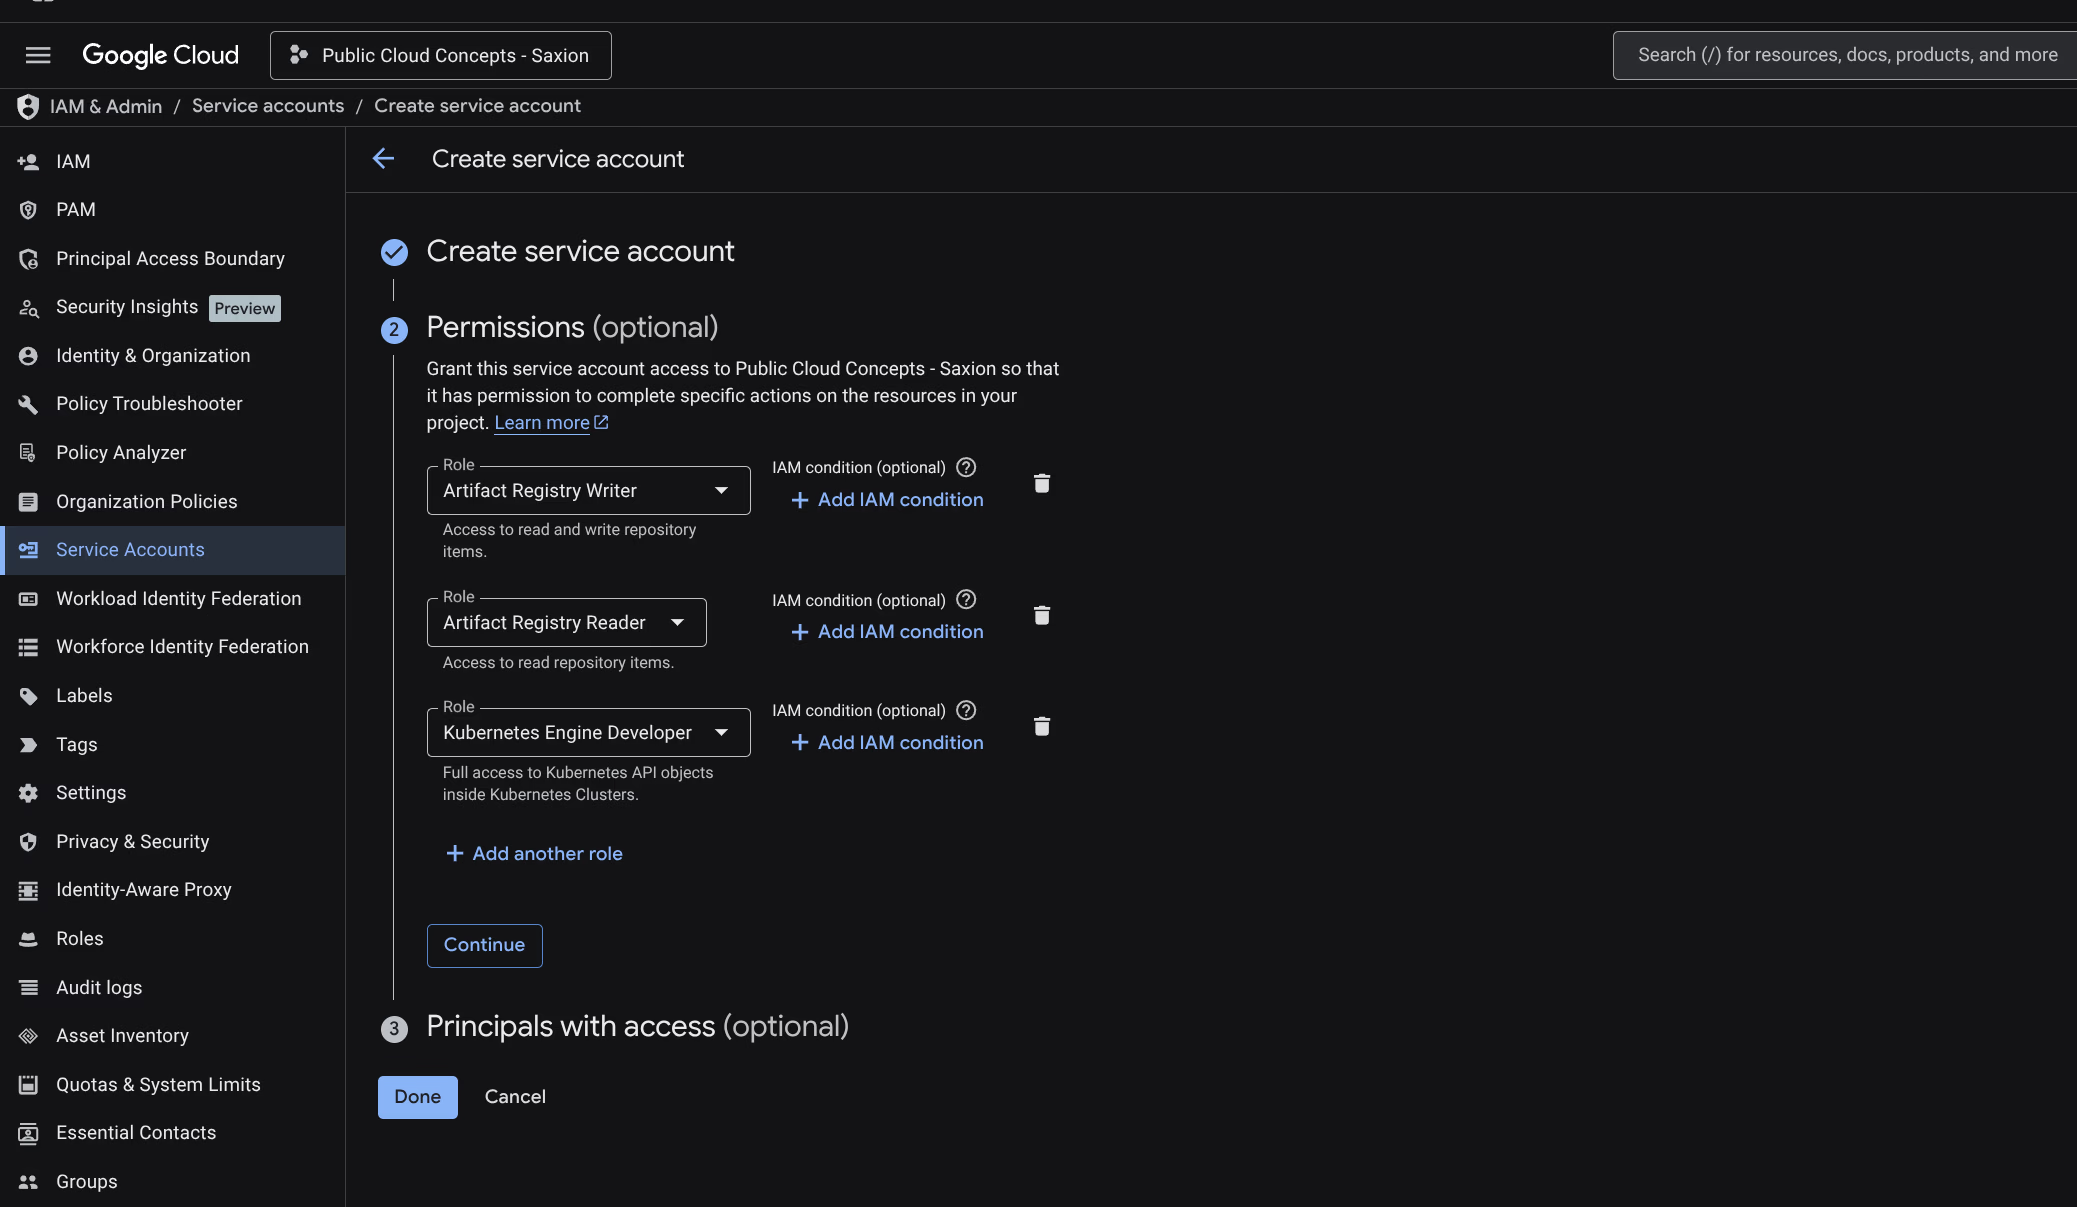
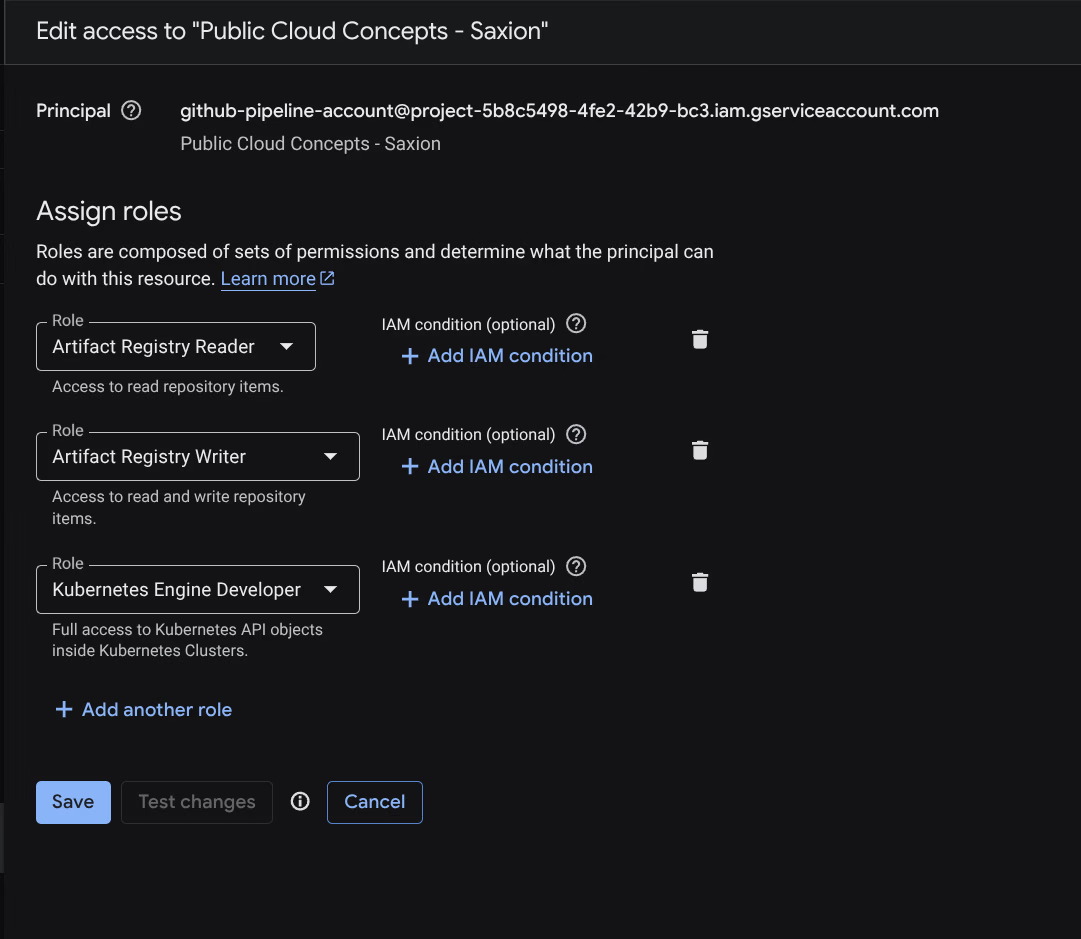
Name: Github Pipeline Account. Roles:
- Artifact Registry Reader
- Artifact Registry Writer
- Kubernetes Engine Developer
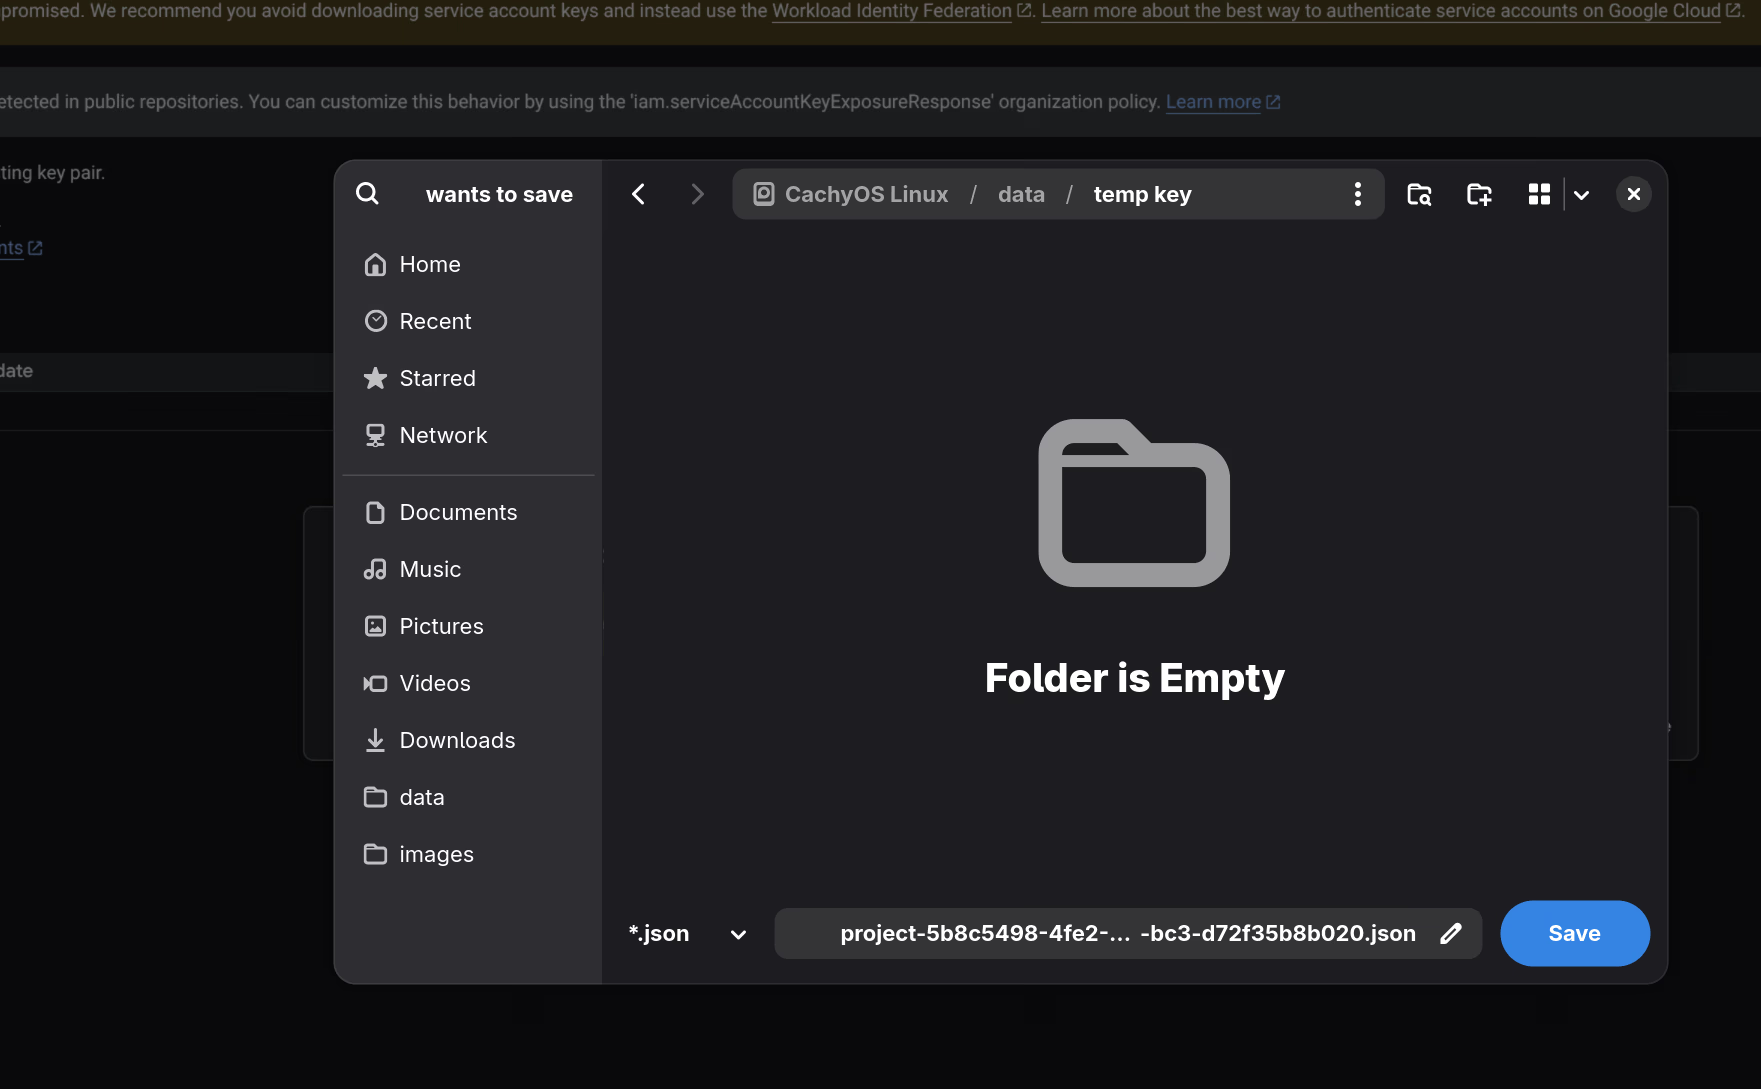
Step 3: Create JSON Key
When creating the key an error appears:
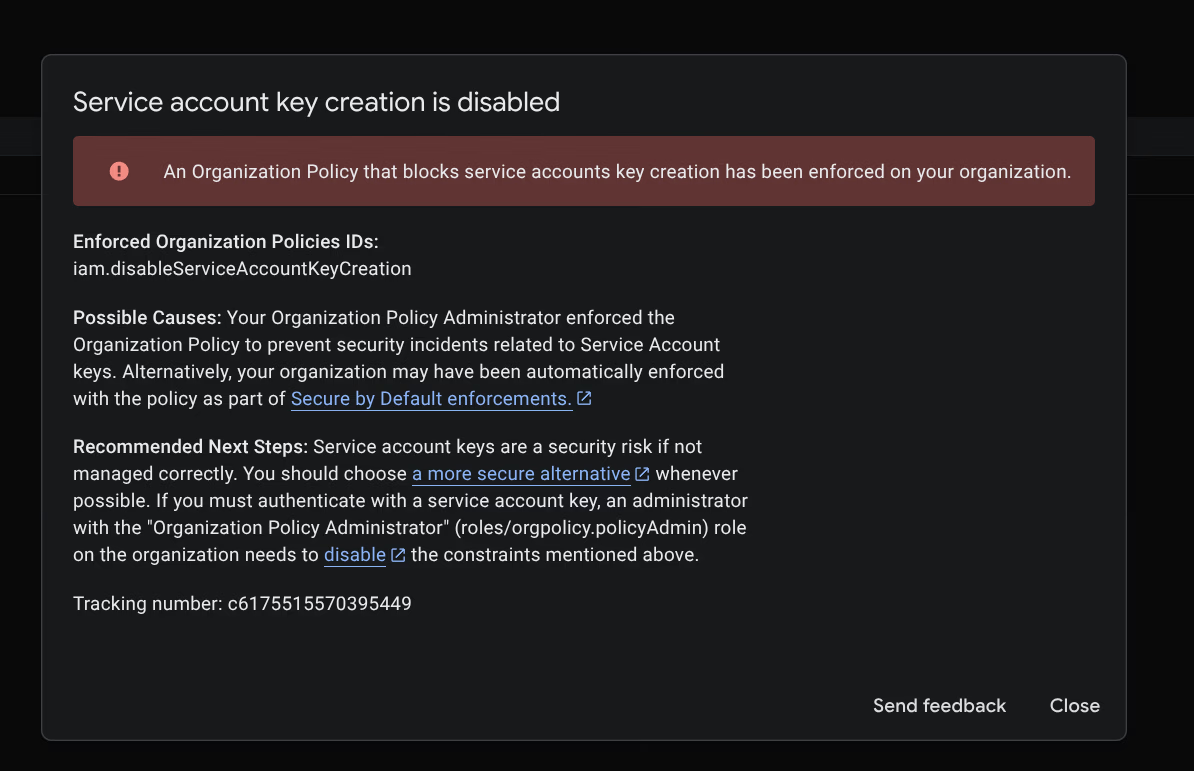
An Organization Policy (iam.disableServiceAccountKeyCreation) blocks this.
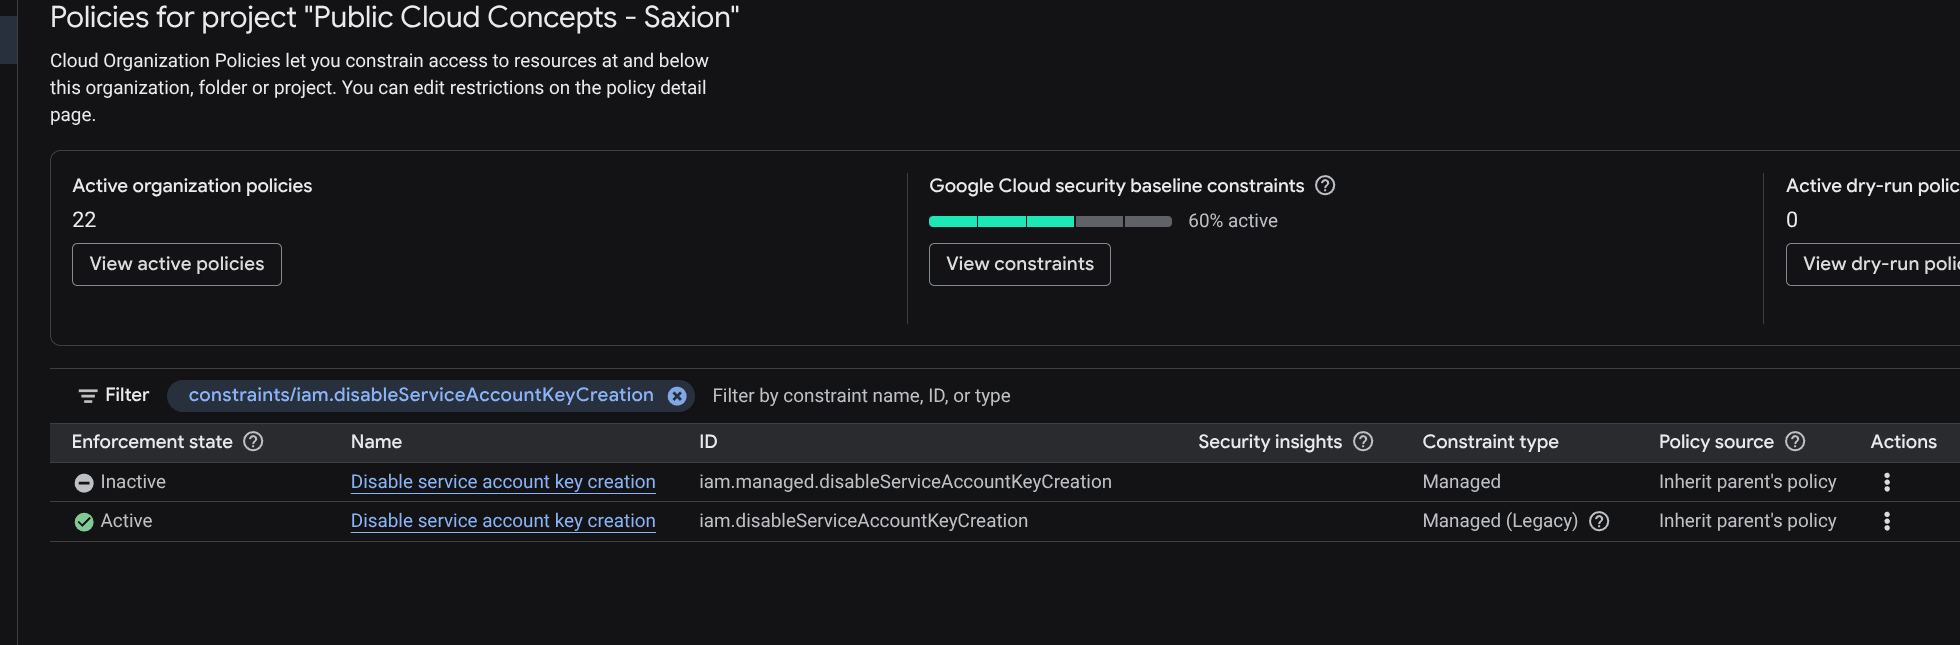
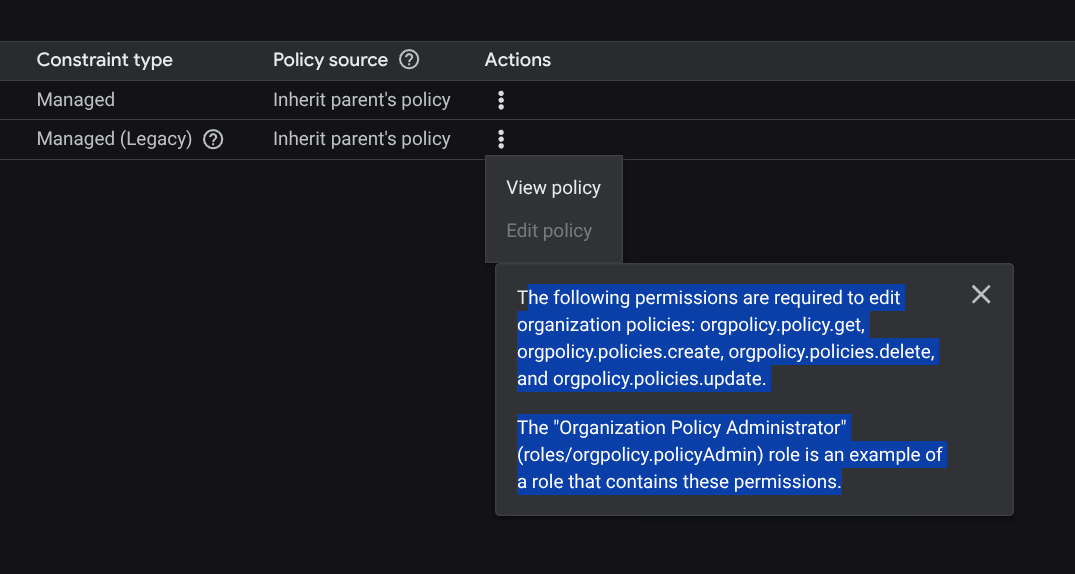
Solved via Cloud Shell:
gcloud organizations list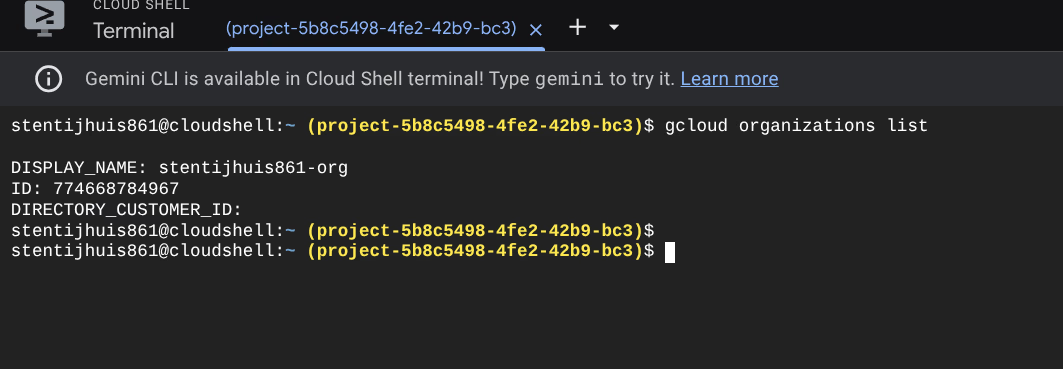
gcloud organizations add-iam-policy-binding 774668784967 \
  --member="user:stentijhuis861@gmail.com" \
  --role="roles/orgpolicy.policyAdmin"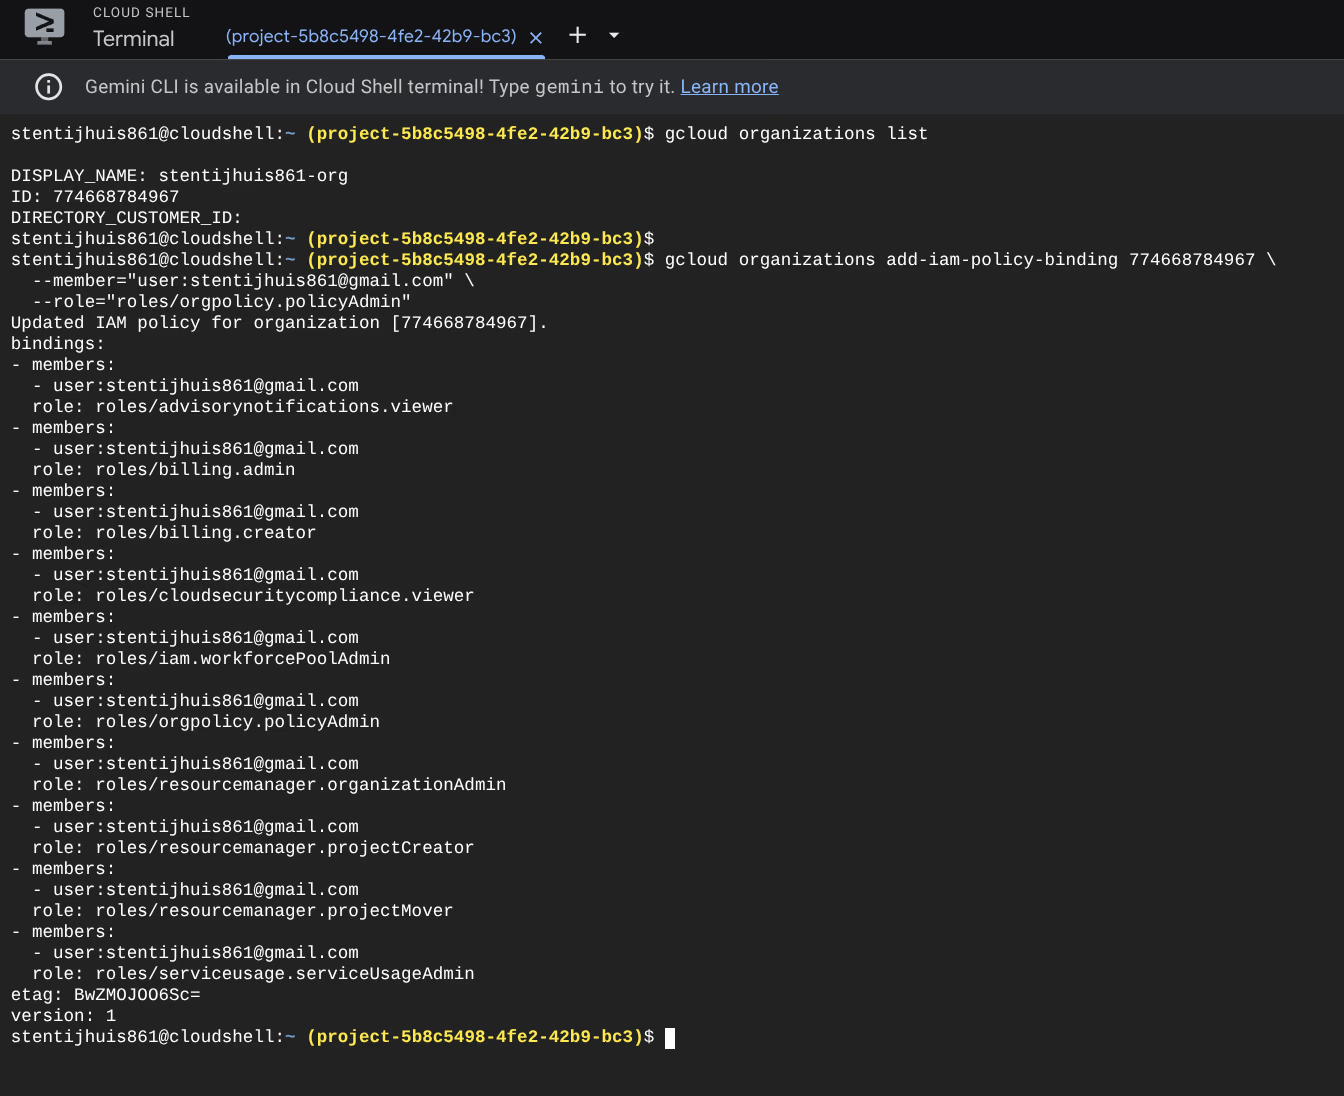
gcloud resource-manager org-policies disable-enforce iam.disableServiceAccountKeyCreation \
  --project=project-5b8c5498-4fe2-42b9-bc3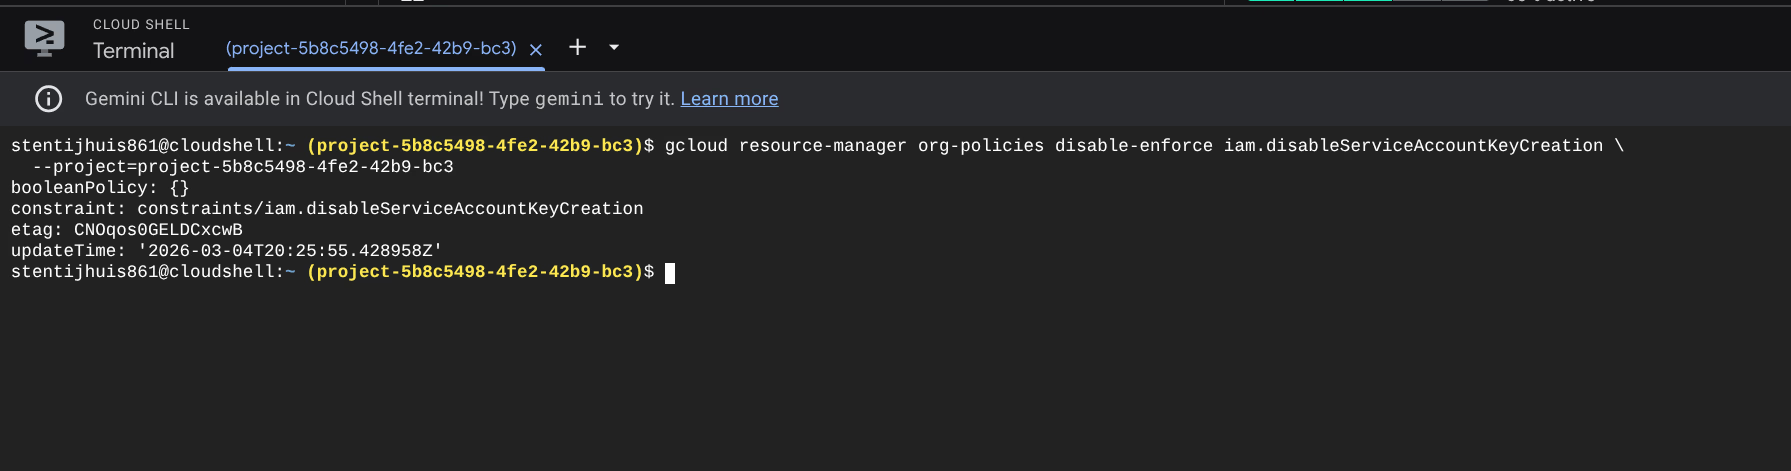
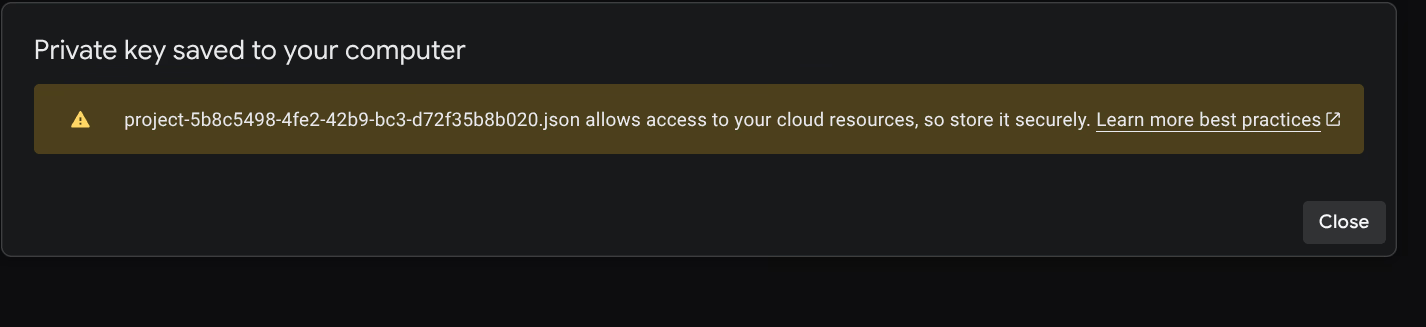
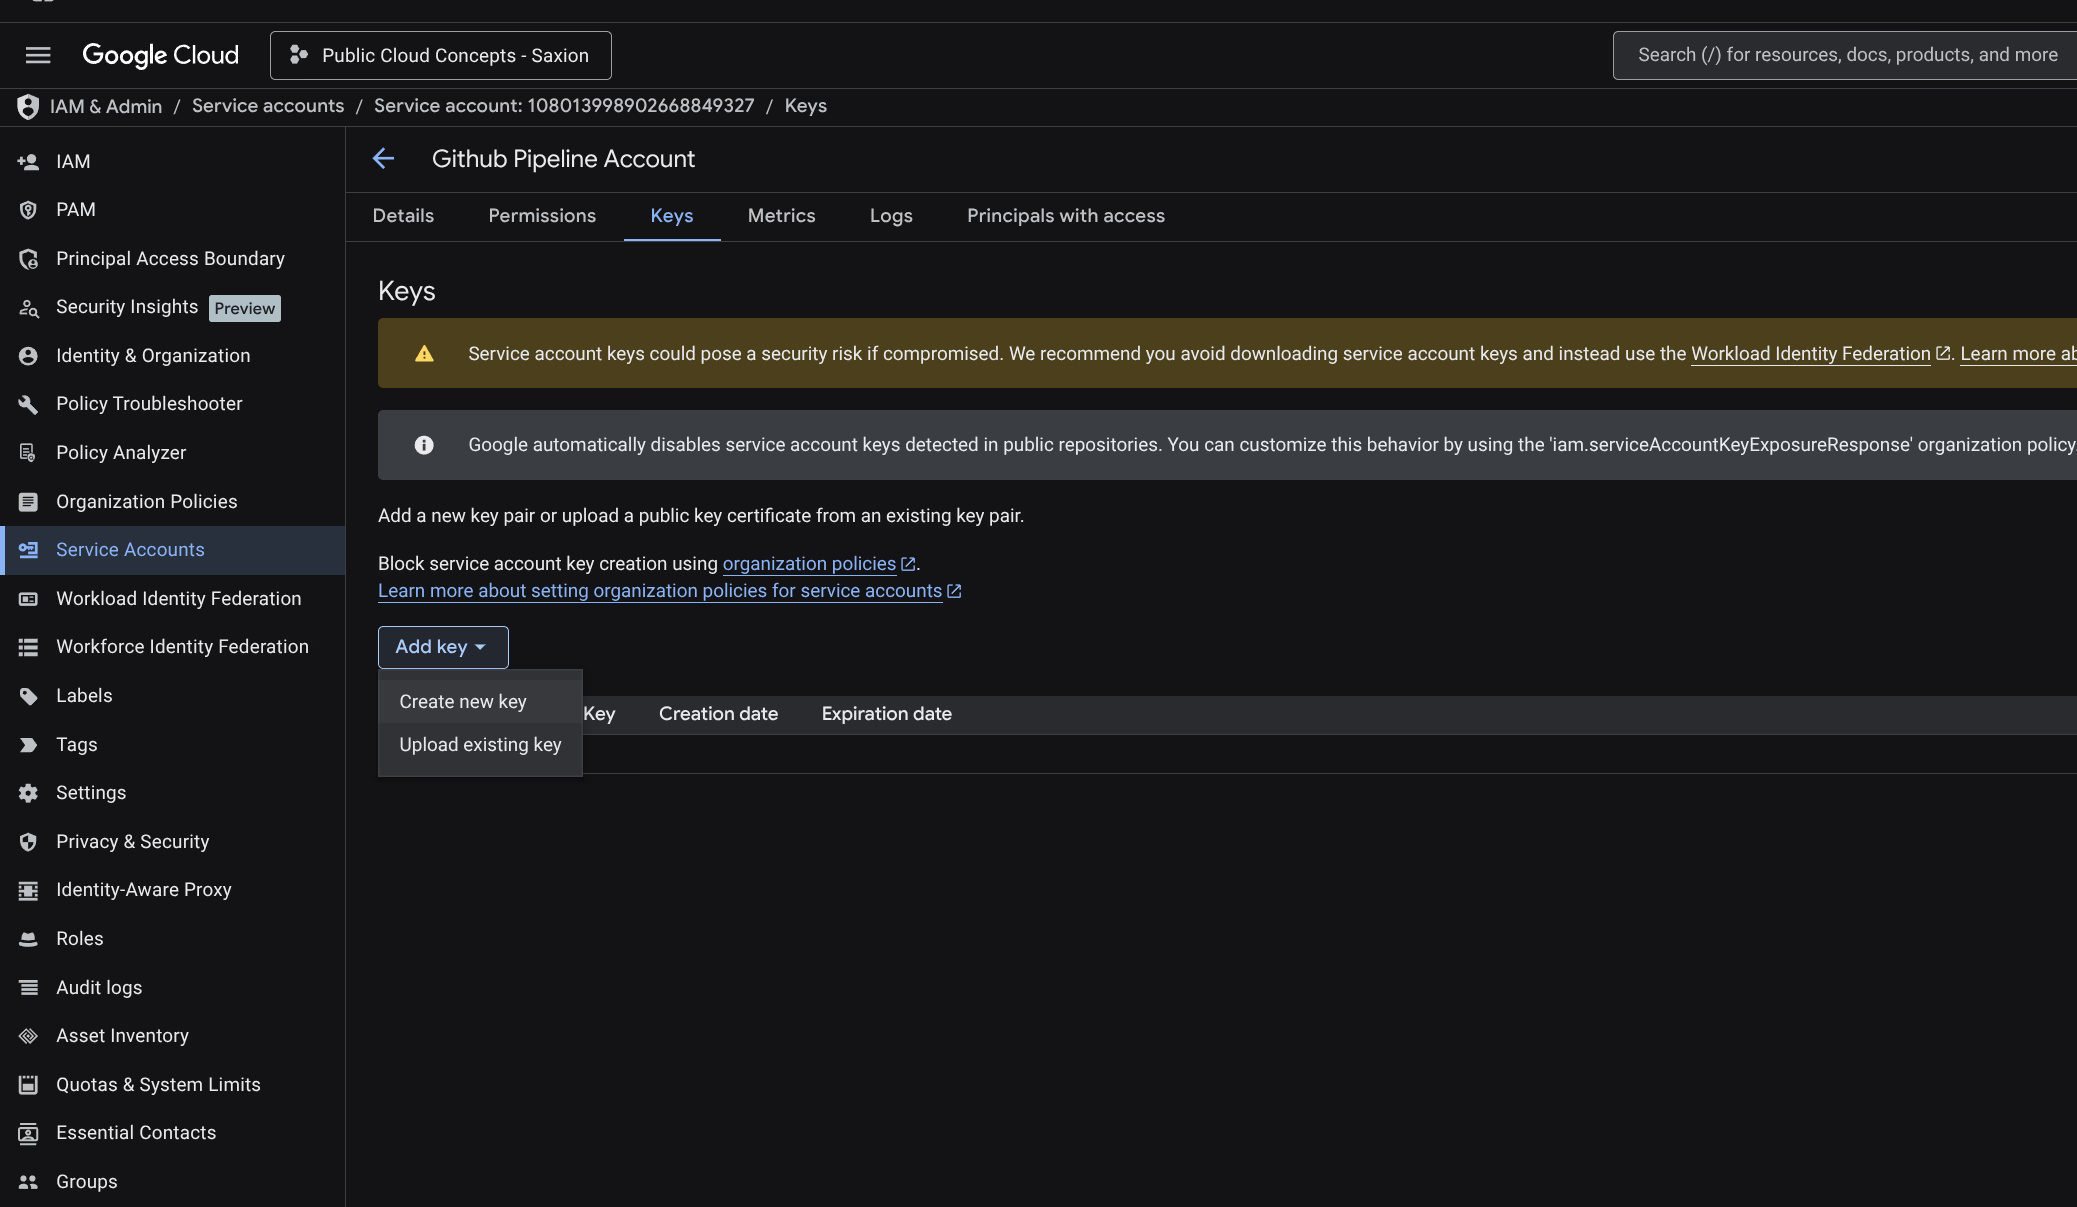
Step 4: Set GitHub Secrets
The JSON key and project details as repository secrets via Settings > Secrets and variables > Actions:
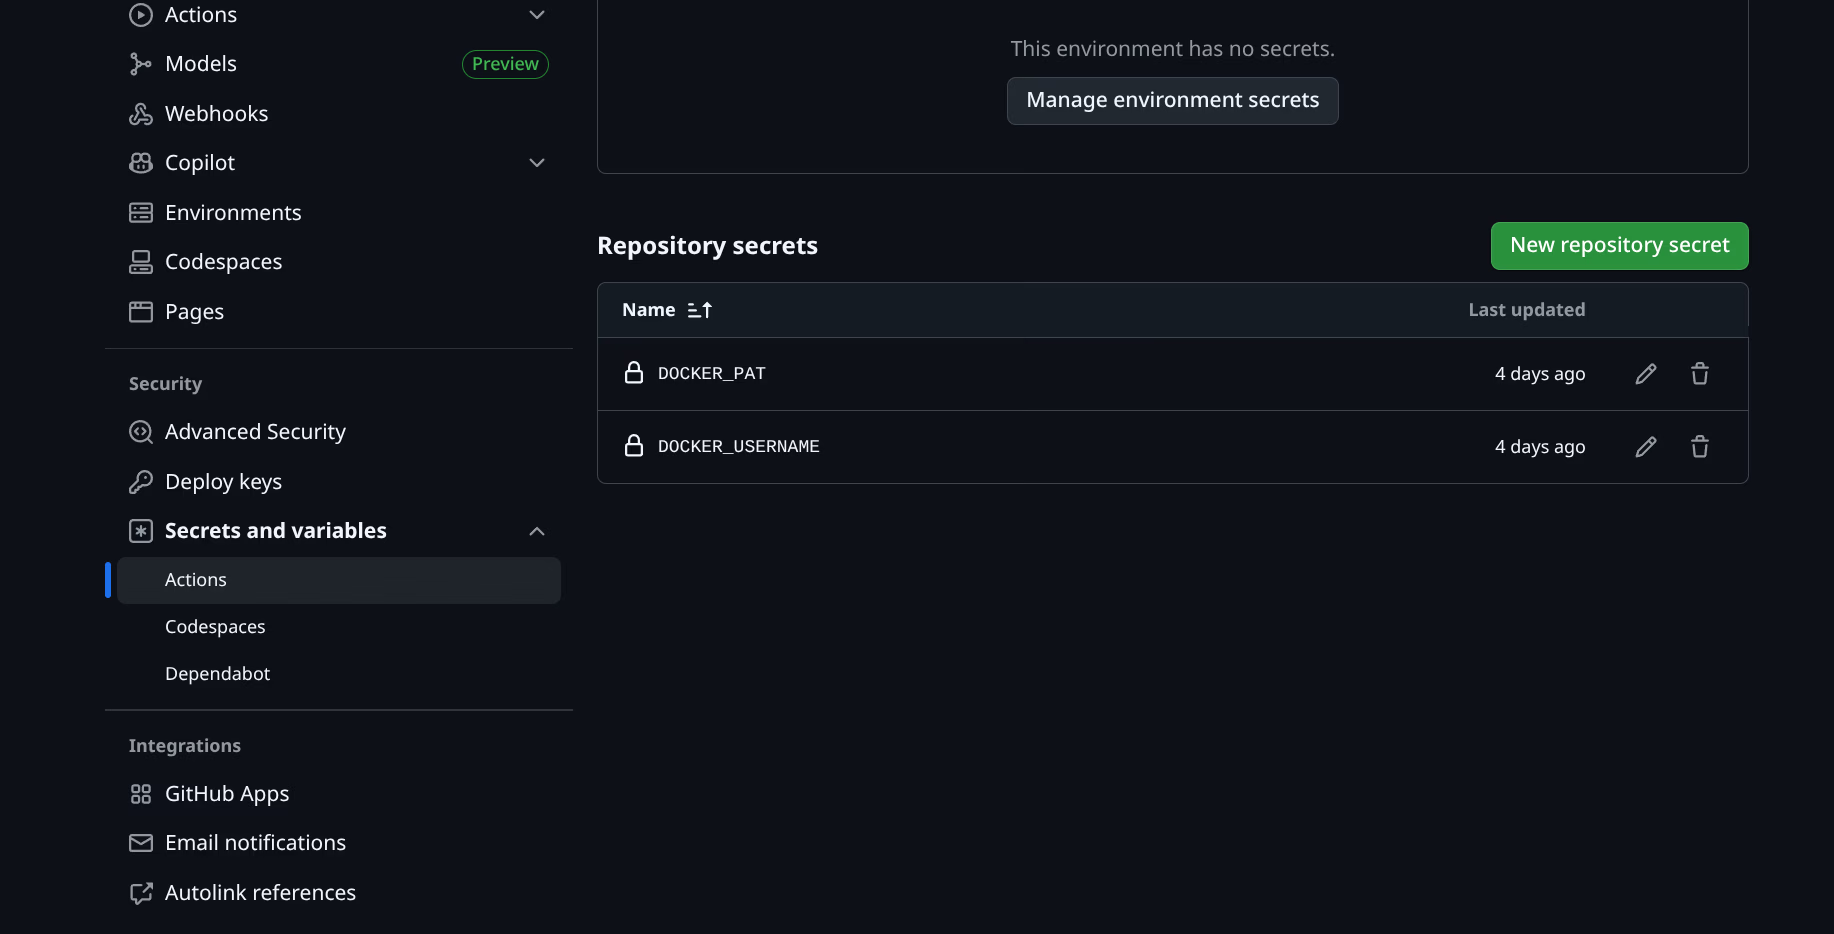
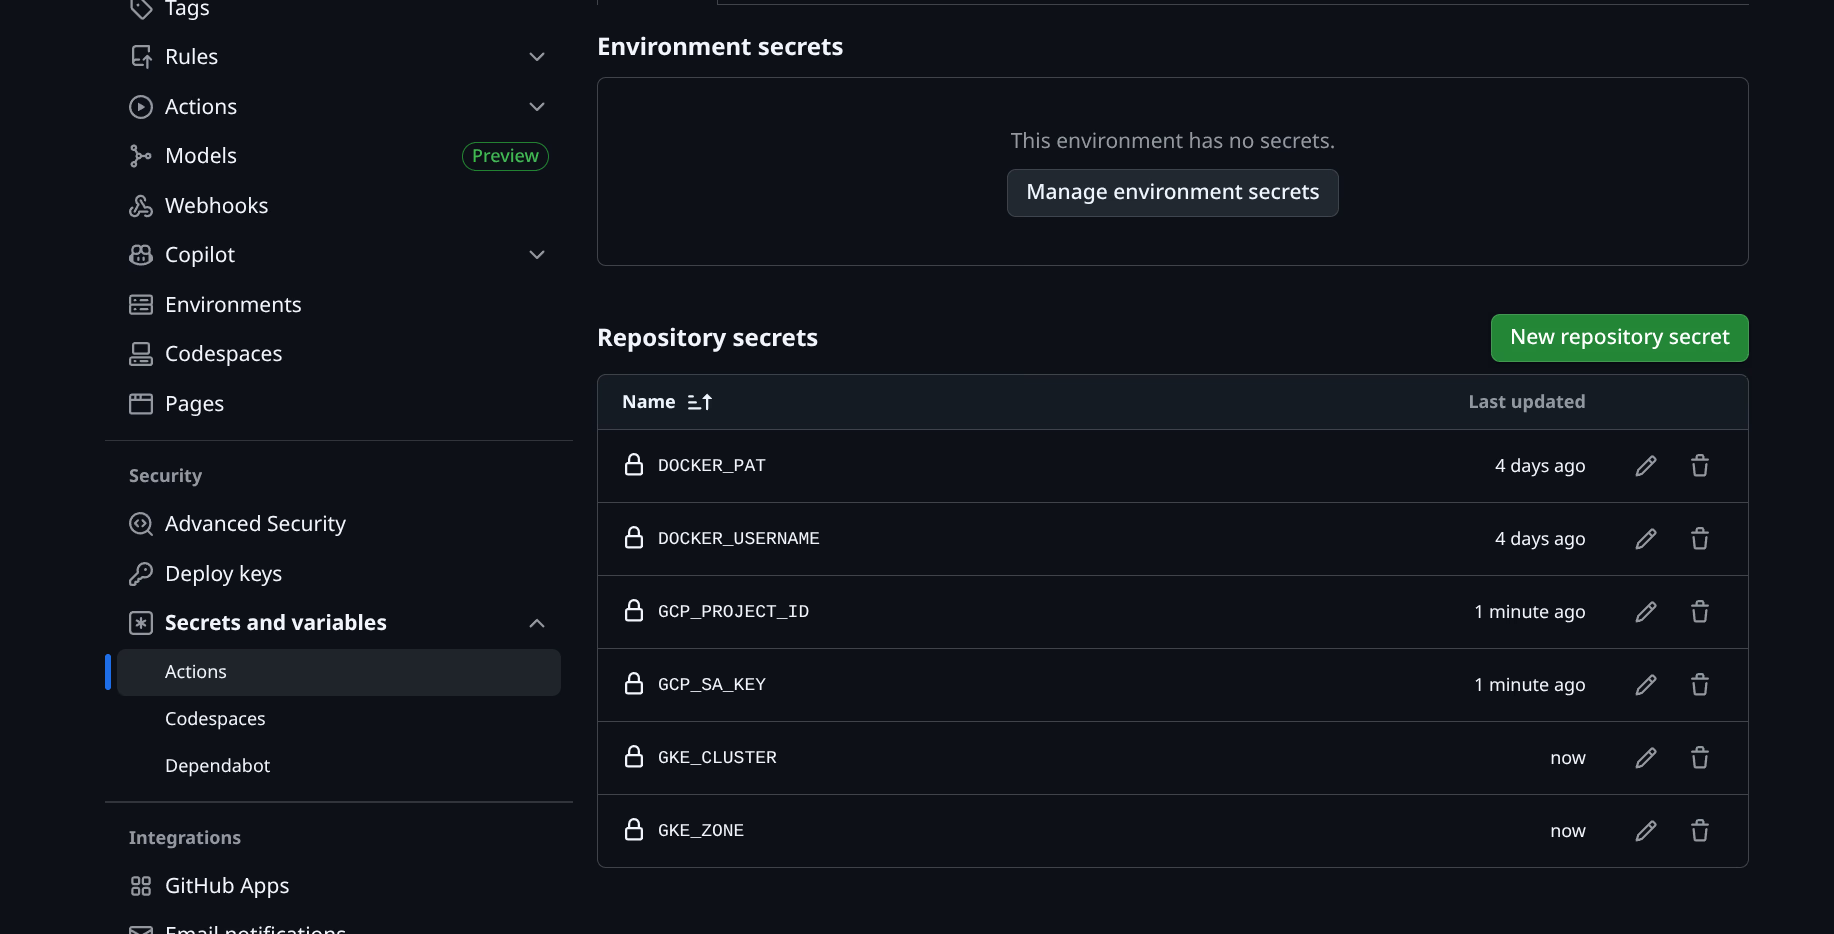
Step 5: Artifact Registry
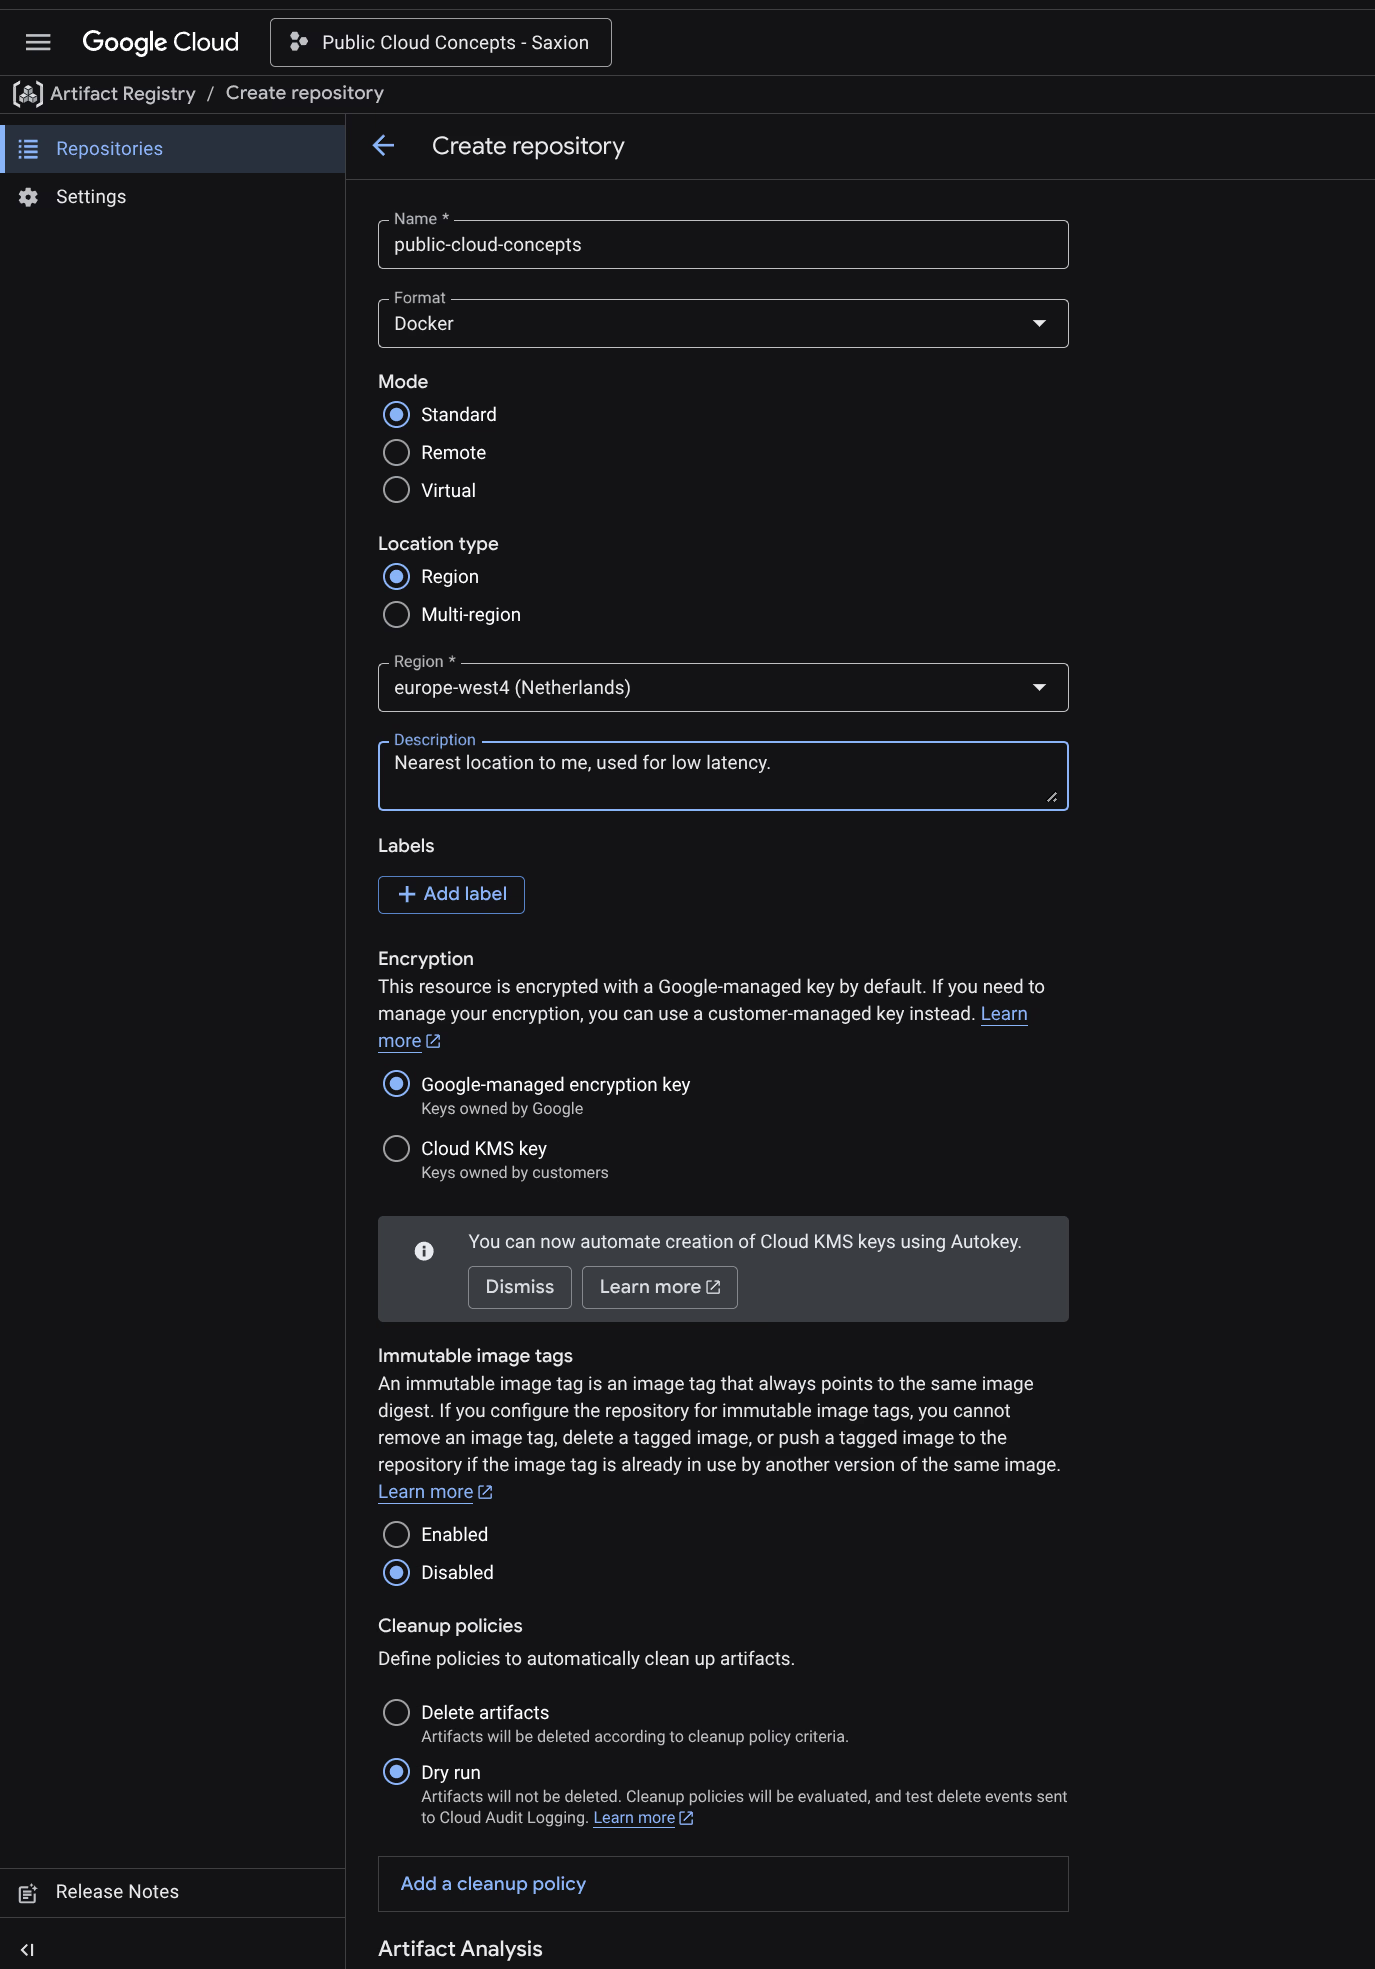
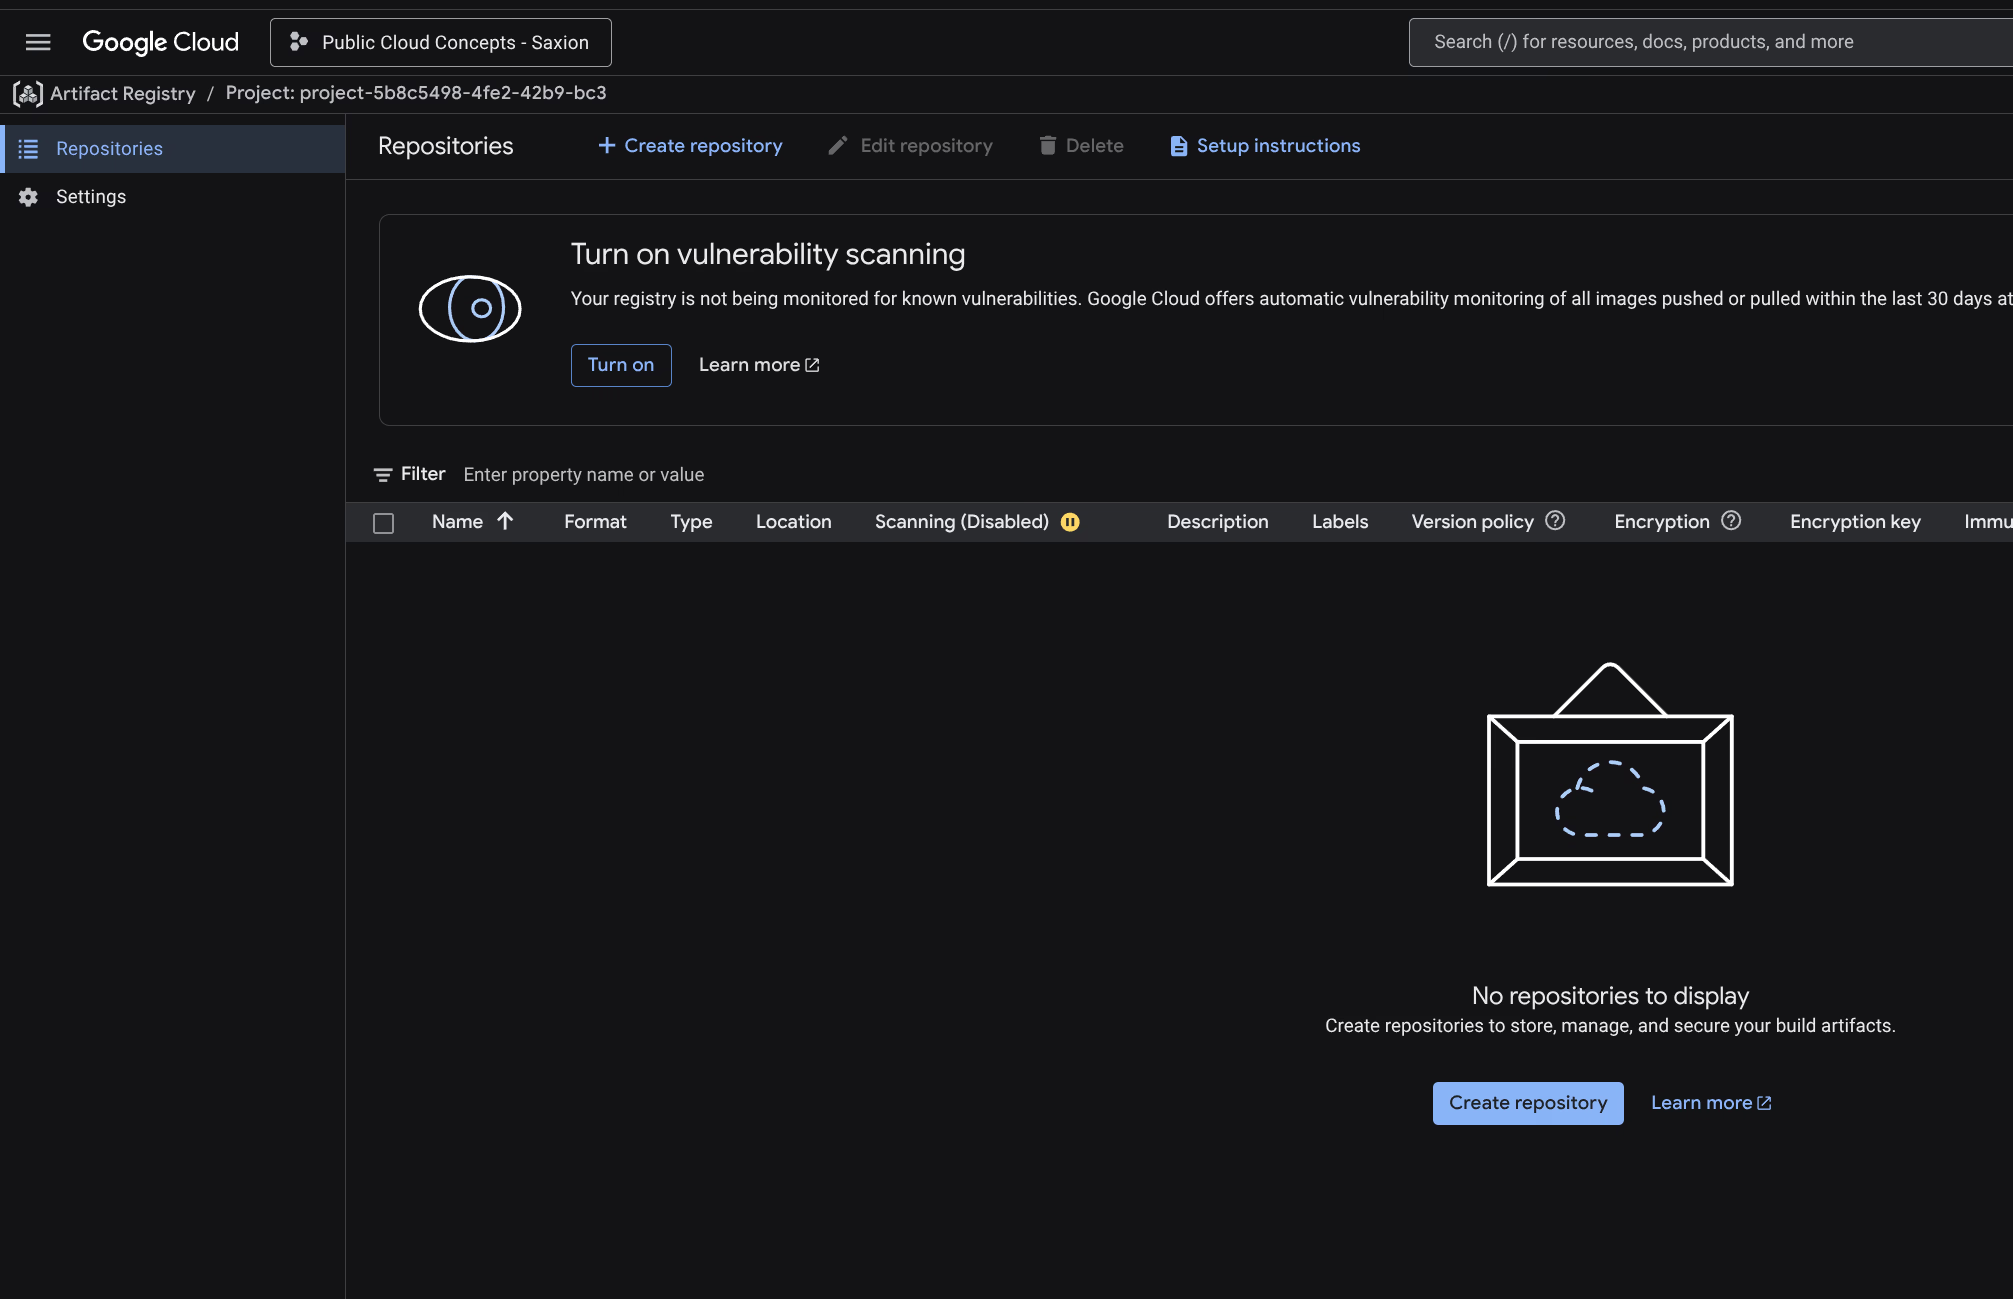
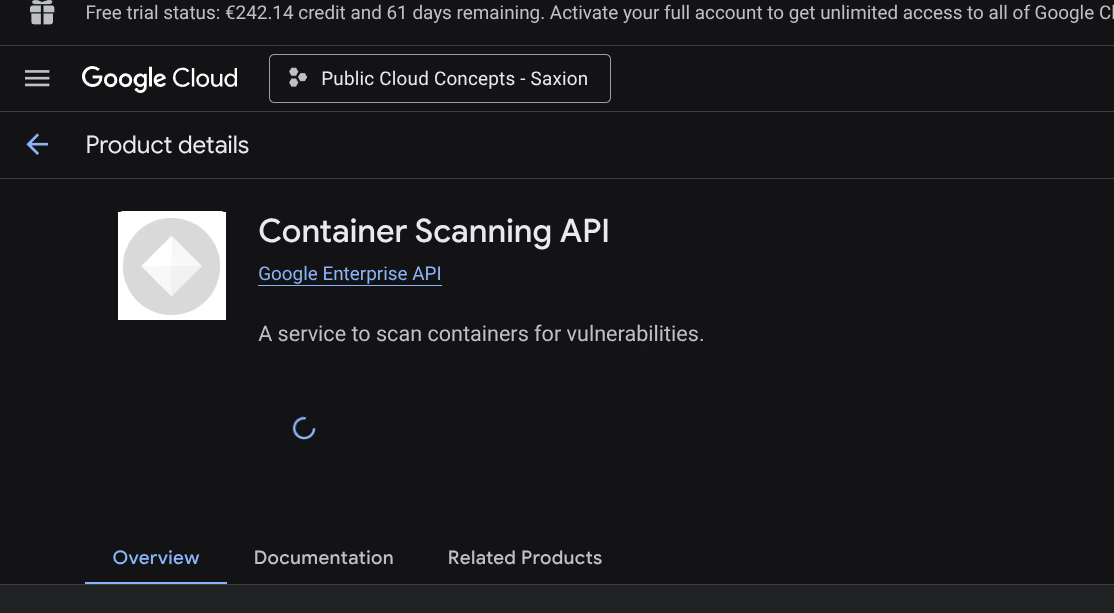
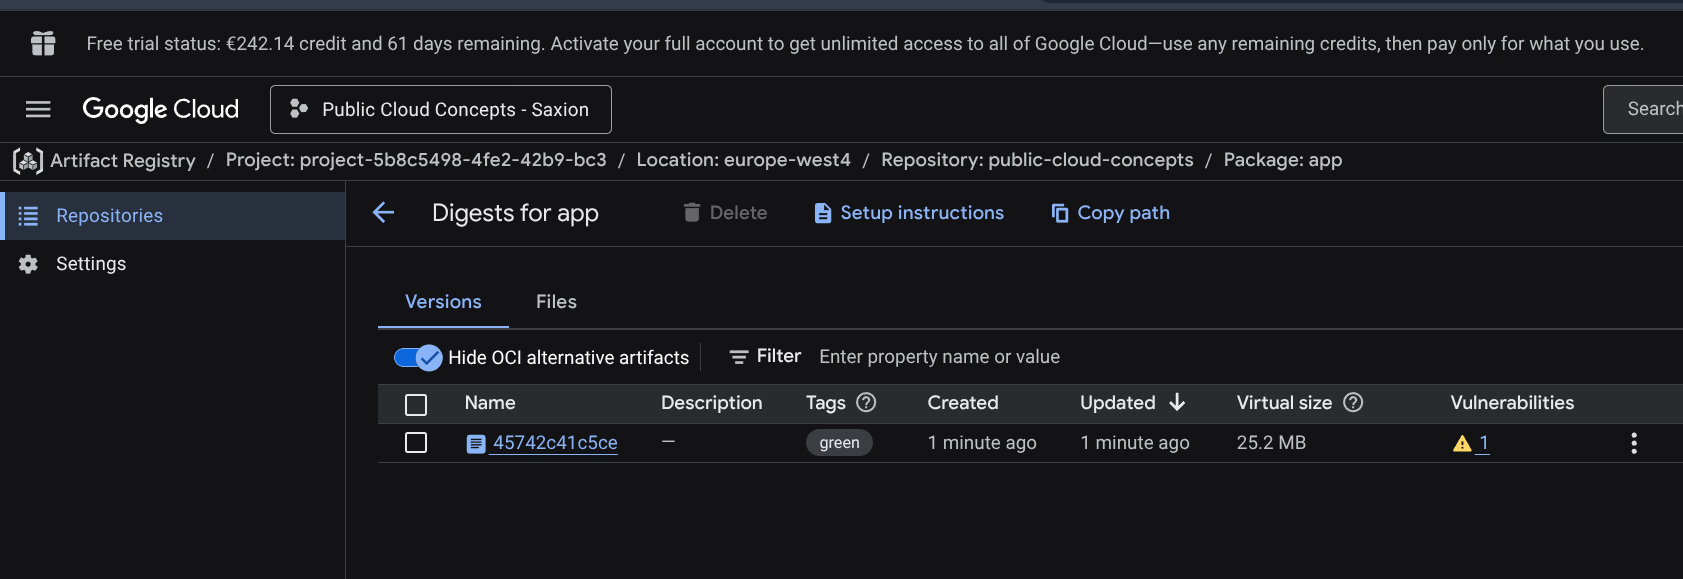
Artifact Registry repository created: public-cloud-concepts, Docker format, europe-west4. Container Scanning API enabled for vulnerability scanning.
IAM configuration
Two identities are involved:
GitHub Pipeline Account - used by GitHub Actions to push images to Artifact Registry and send kubectl commands to GKE.
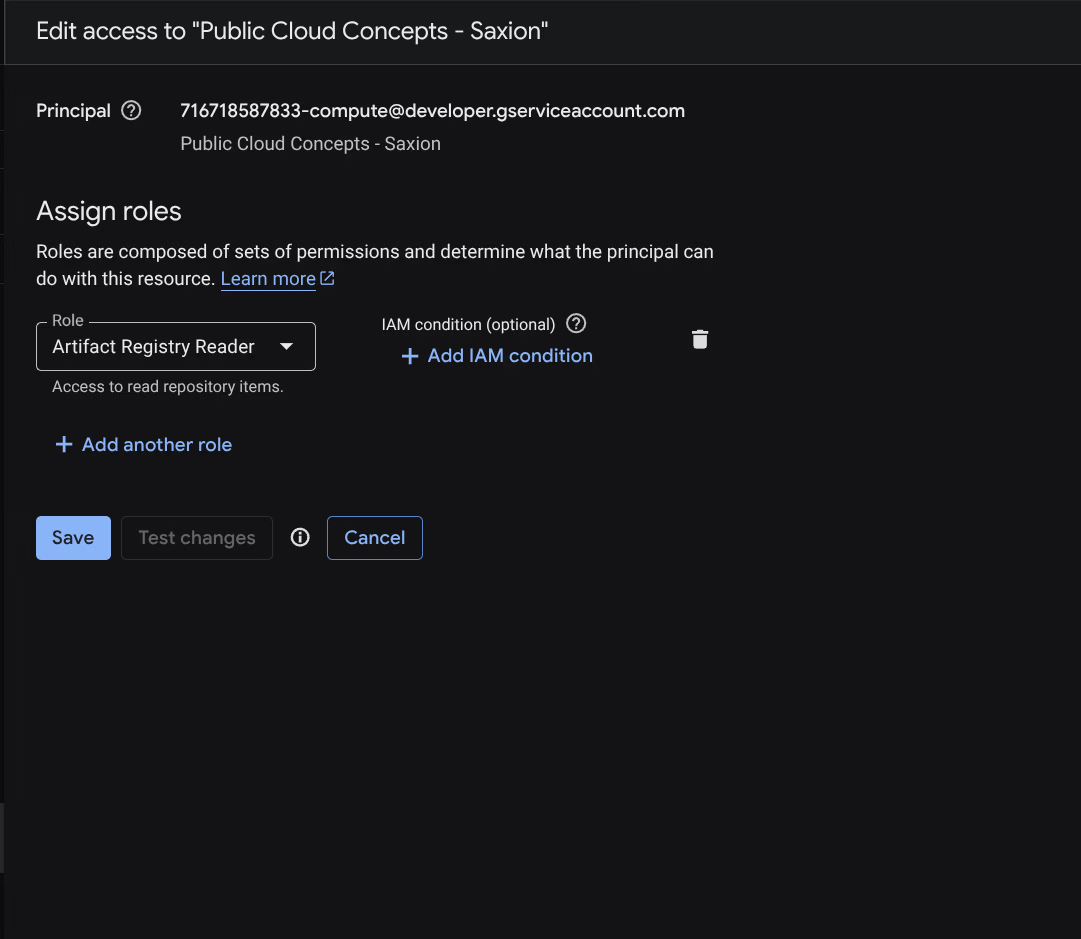
Compute Engine default service account - used by the GKE nodes to pull images when starting pods. Without Artifact Registry Reader on this account you get an ImagePullBackOff error, even if the pipeline account has the correct permissions.
Result
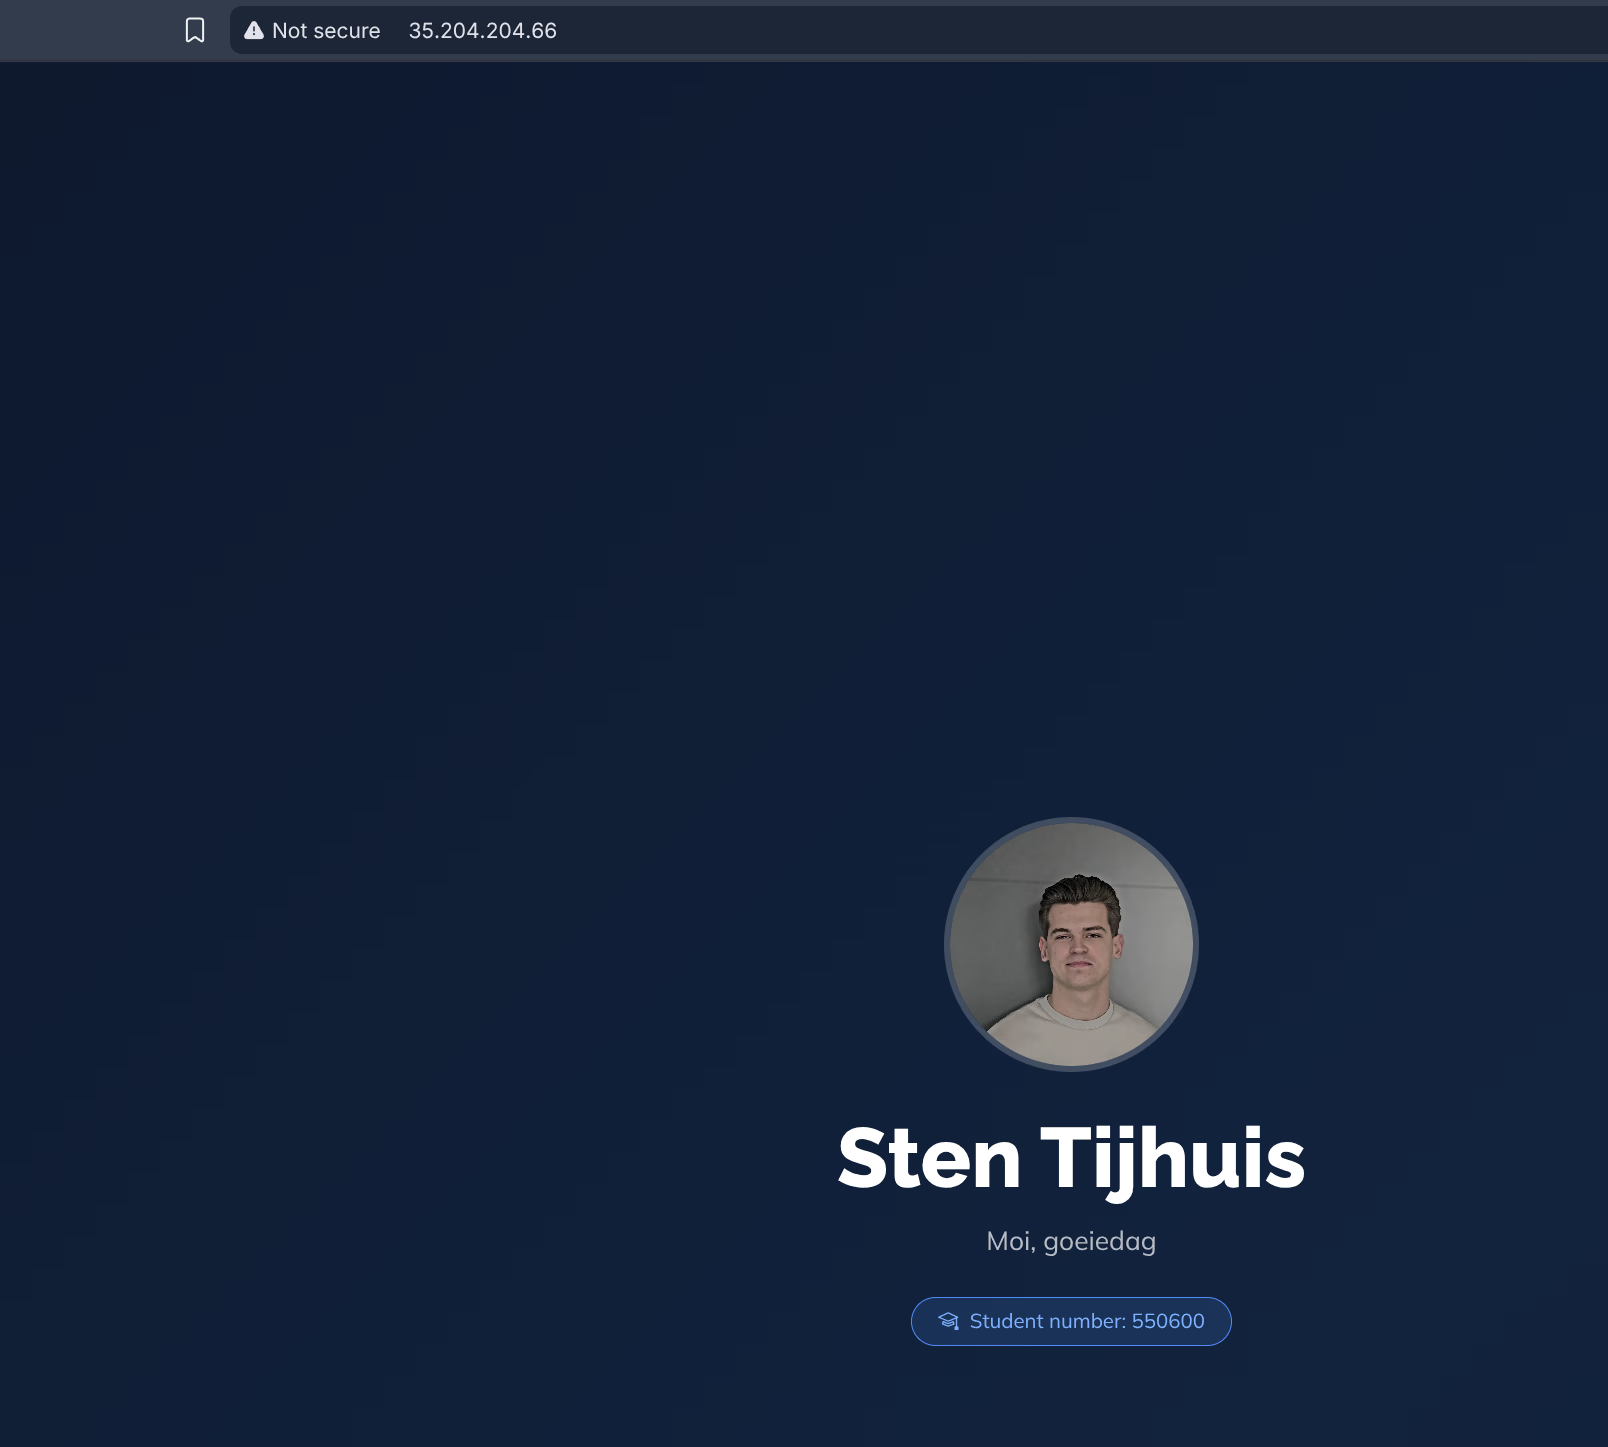
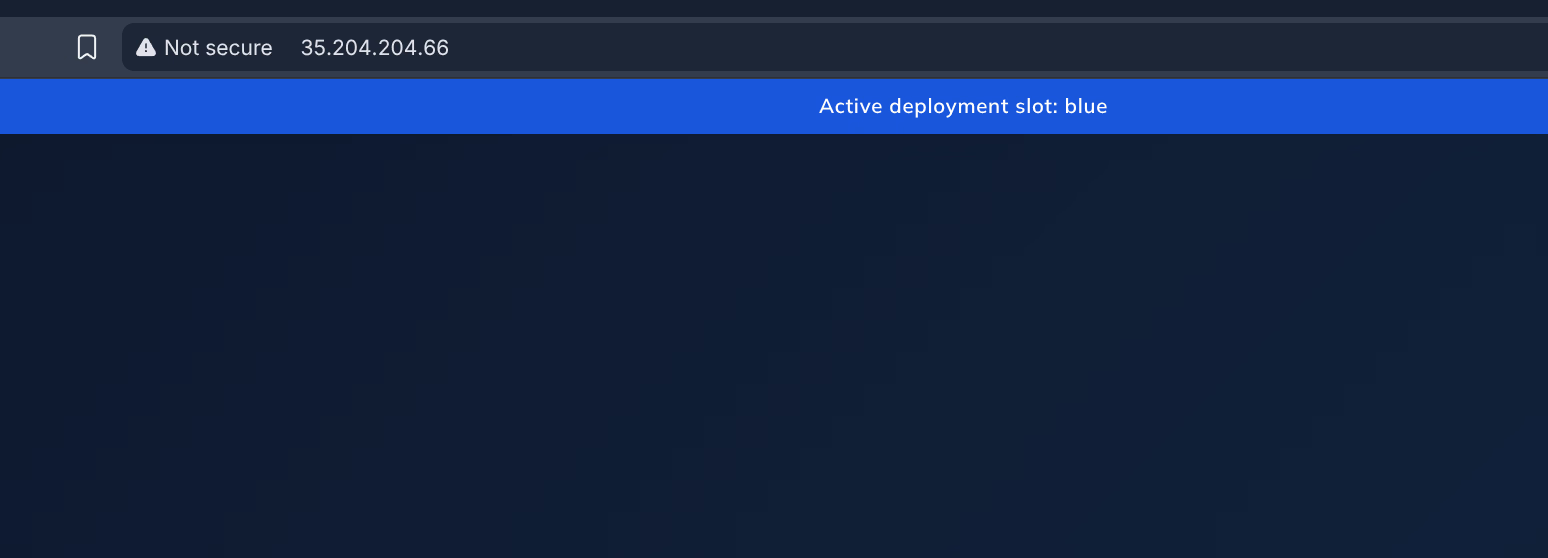
Testing both deployments in parallel
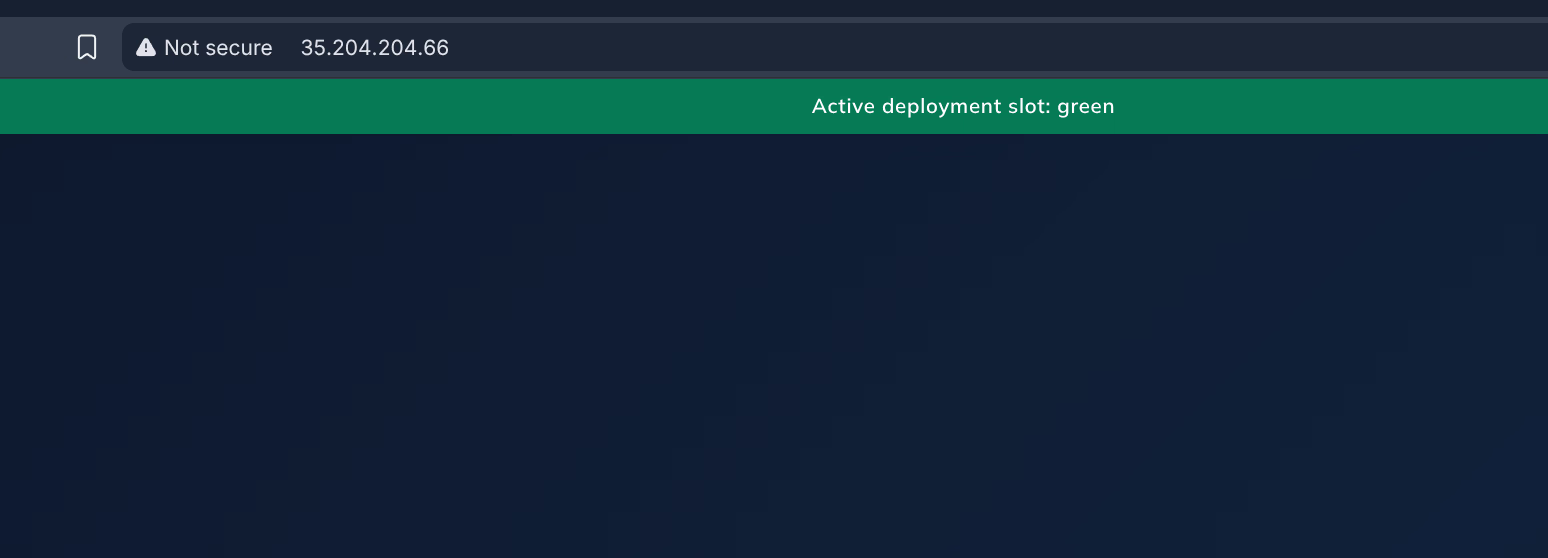
Both deployments run at the same time. The Service determines which slot receives traffic via the selector. Switching can be done in two ways: via the command line or via a GitHub Actions workflow.
Option 1: Command line (kubectl)
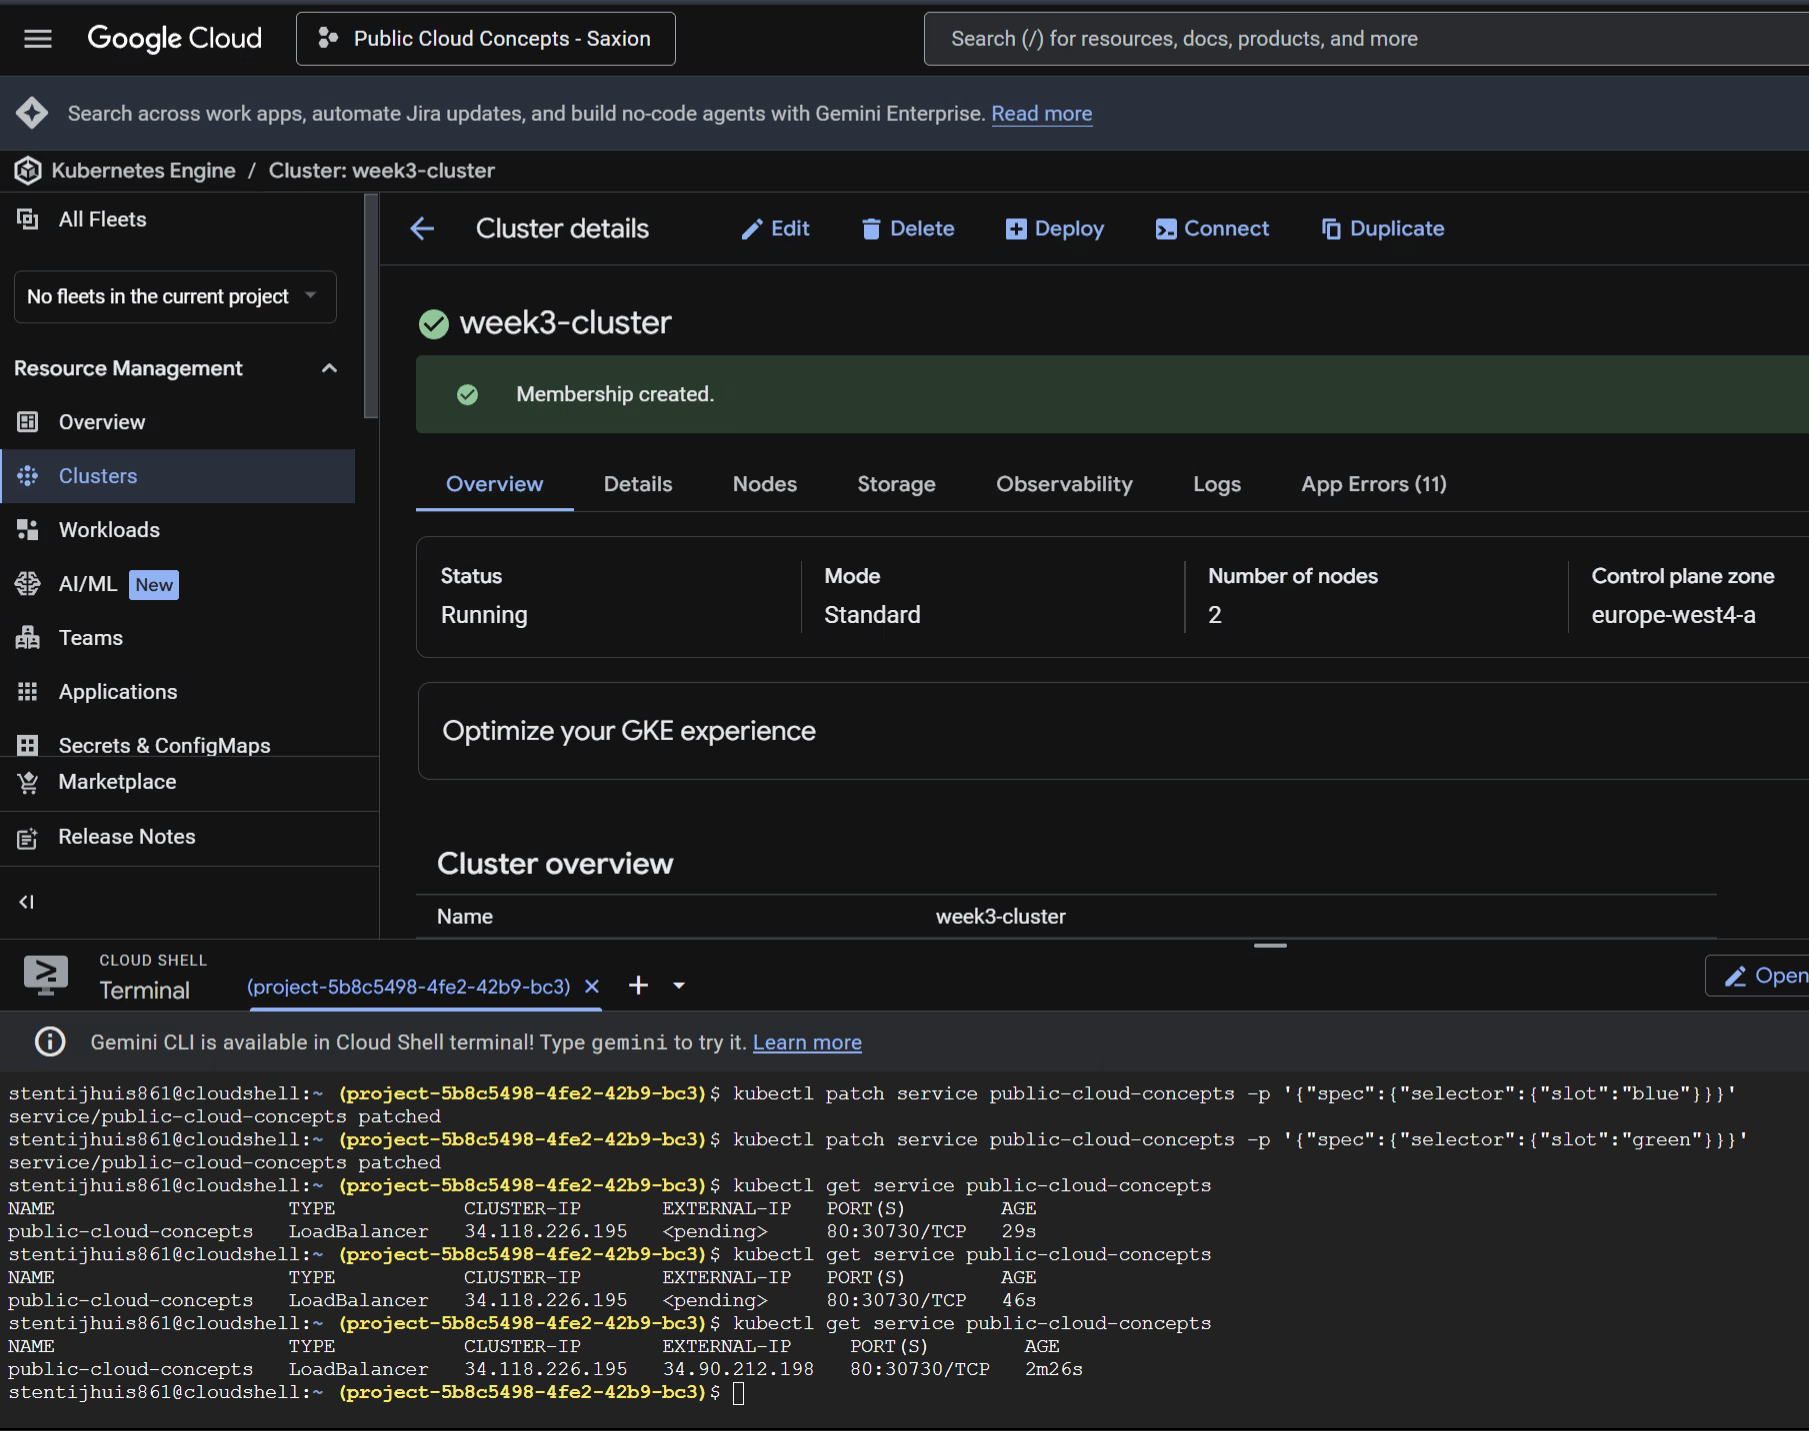
kubectl patch directly updates the selector in the Service. Kubernetes immediately routes traffic to the new pods, without a restart or downtime.
# Switch to green
kubectl patch service public-cloud-concepts \
  -p '{"spec":{"selector":{"slot":"green"}}}'

# Switch back to blue
kubectl patch service public-cloud-concepts \
  -p '{"spec":{"selector":{"slot":"blue"}}}'
Then verify which slot is active:
kubectl get service public-cloud-concepts \
  -o jsonpath='Active slot: {.spec.selector.slot}{"\n"}'
kubectl patch is the recommended way for blue-green switching in Kubernetes. It is atomic: the selector update is a single API call and Kubernetes ensures traffic goes directly to the new pods. The pipeline uses kubectl apply (idempotent: also creates the Service if it does not exist yet), but for manual switching patch is faster and more direct.Option 2: GitHub Actions workflow (GUI)
For those who do not want to switch via the command line, there is the switch-slot workflow: a manual workflow (workflow_dispatch) that you can start from the GitHub Actions UI. You choose blue or green, and the pipeline does the rest.
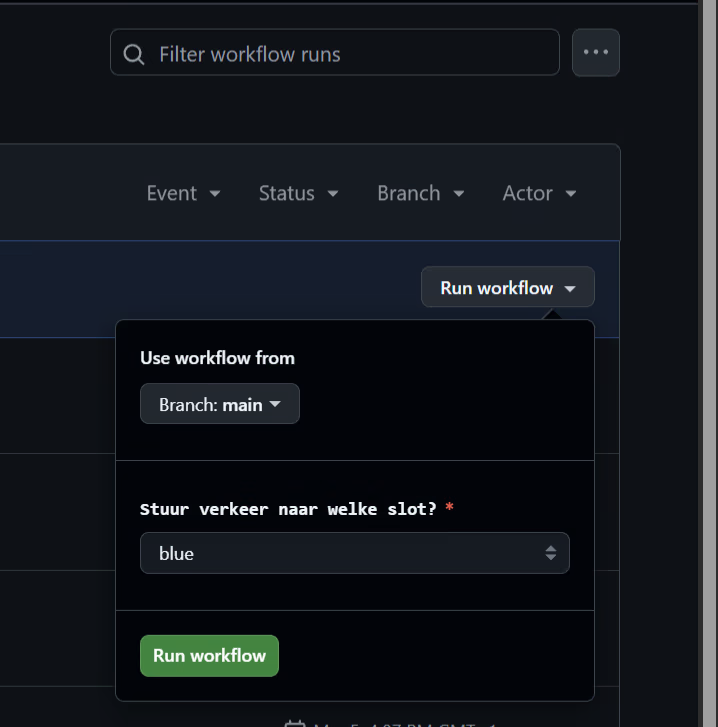
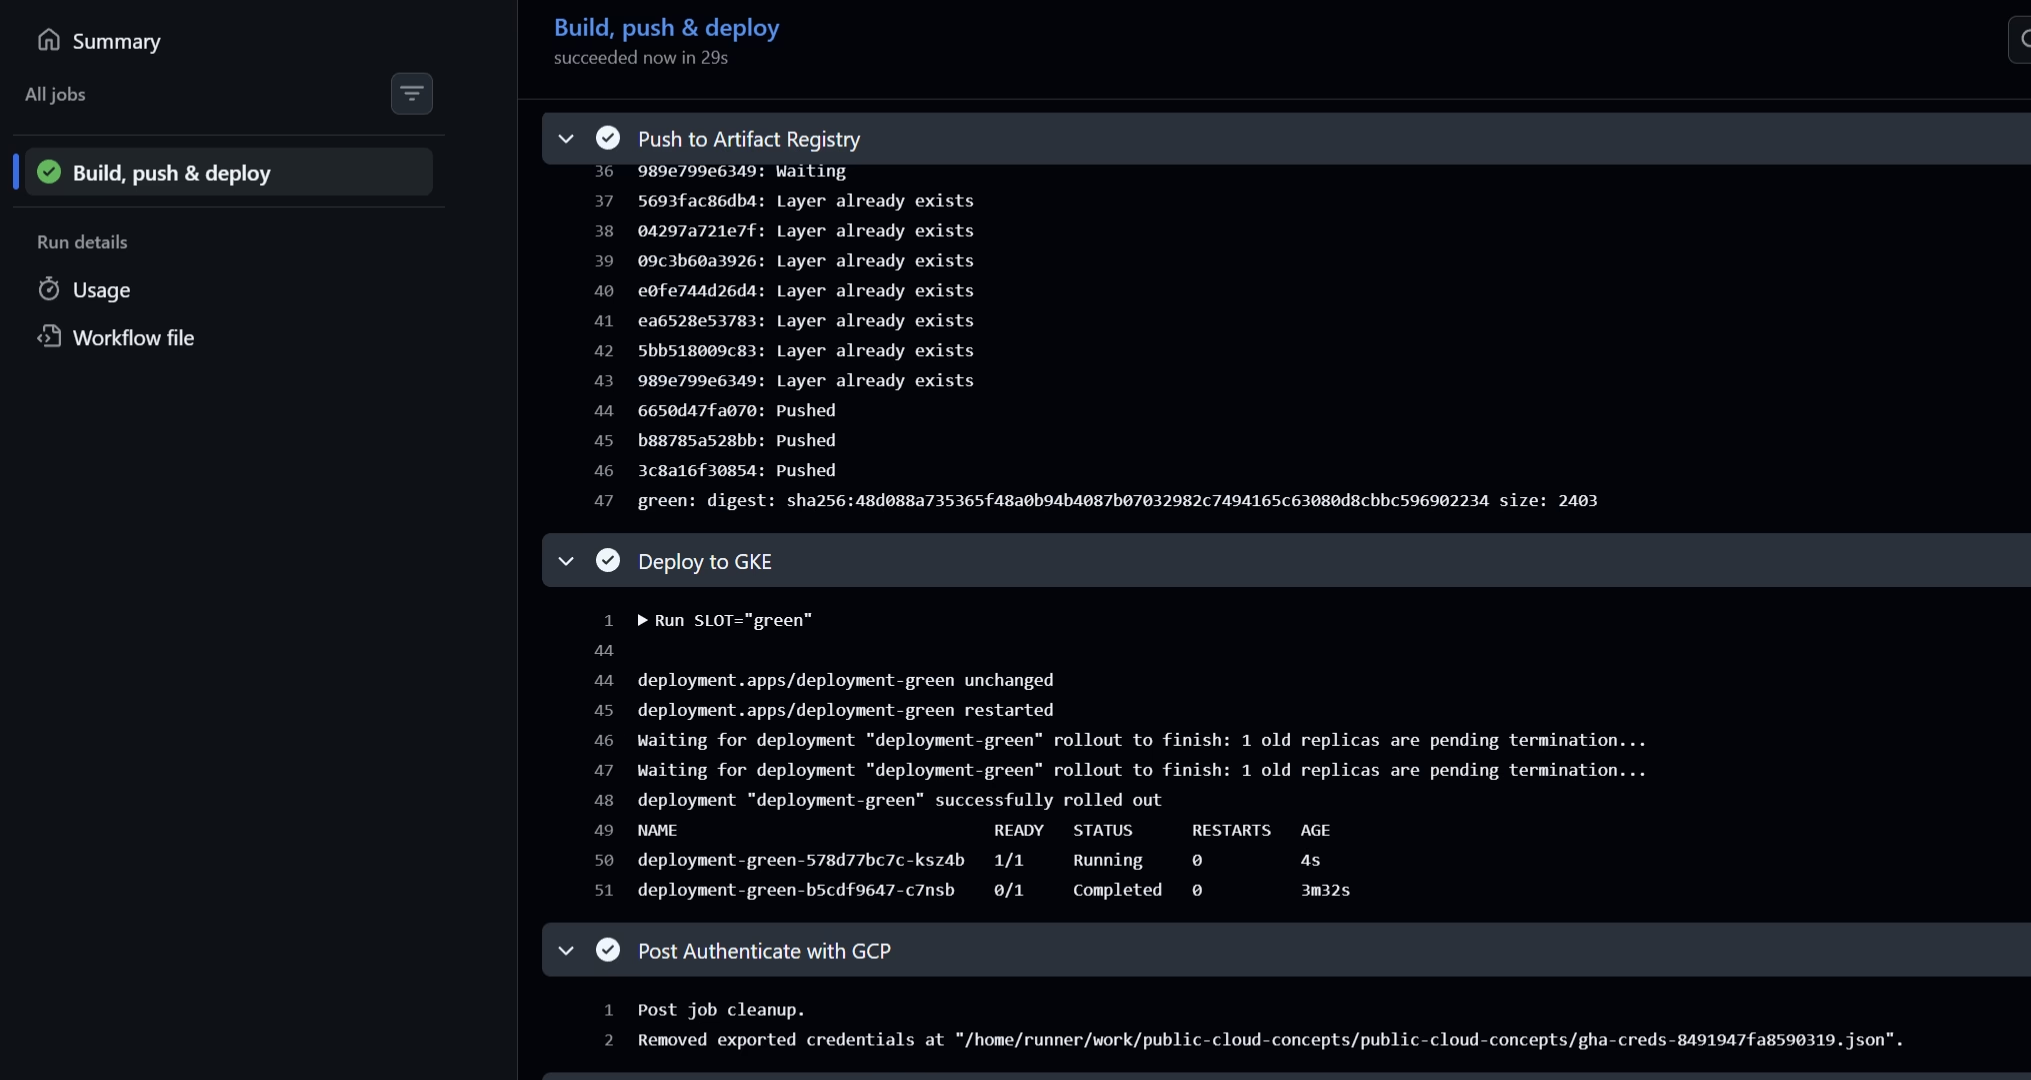
The workflow shows the active slot and running pods after the switch:
Active slot: blue
NAME                                READY   STATUS    RESTARTS   AGE
deployment-blue-78c48bc59-m7xqm     1/1     Running   0          7m48s
deployment-green-7fbf59cf77-q2nxj   1/1     Running   0          7m32s
So you have both a command line option and a small GUI; both lead to the same result.

Connecting to the cluster and checking status
Connecting to the cluster
Set up kubeconfig for kubectl access:
gcloud container clusters get-credentials week3-cluster \
  --region europe-west4-a \
--project <GCP_PROJECT_ID>Getting the external IP address
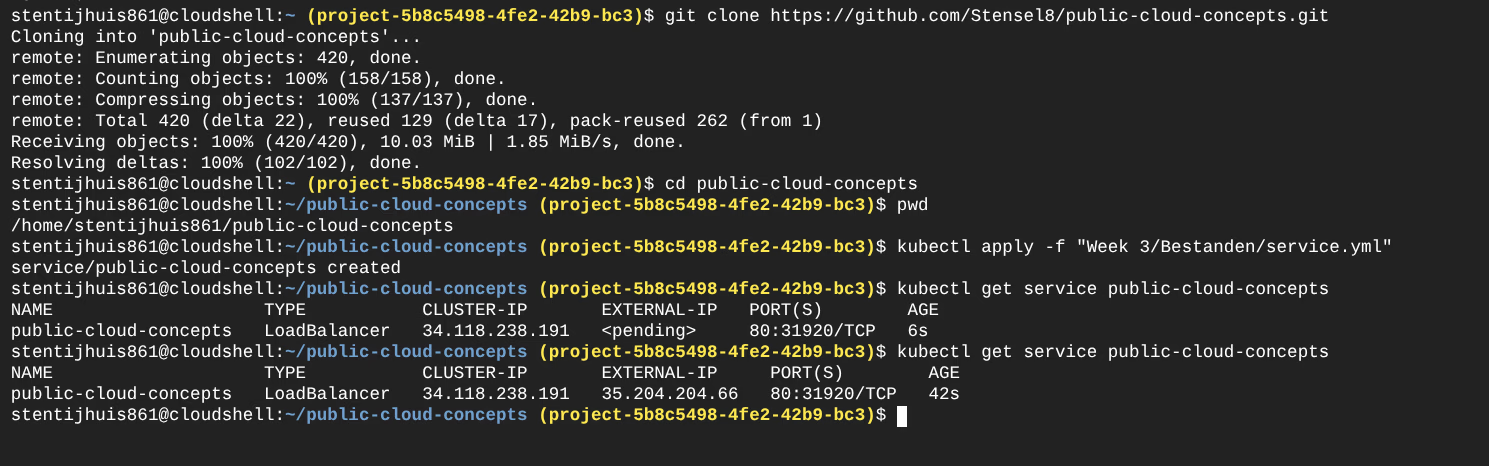
Get the external IP via the LoadBalancer Service:
kubectl get service public-cloud-conceptsOutput:
NAME                    TYPE           CLUSTER-IP     EXTERNAL-IP      PORT(S)        AGE
public-cloud-concepts   LoadBalancer   10.X.X.X       <EXTERNAL-IP>    80:XXXXX/TCP   Xm
The EXTERNAL-IP field is the public IP address at which the application is reachable on port 80. This address is assigned by the Google Cloud load balancer.
Checking the active slot
Which slot is currently receiving traffic:
kubectl get service public-cloud-concepts \
  -o jsonpath='{.spec.selector.slot}'
This returns blue or green.
Overview of running deployments
All deployments and their status:
kubectl get deploymentsNAME READY UP-TO-DATE AVAILABLE AGE
deployment-blue 1/1 1 1 Xm
deployment-green 1/1 1 1 XmPods including their slot label:
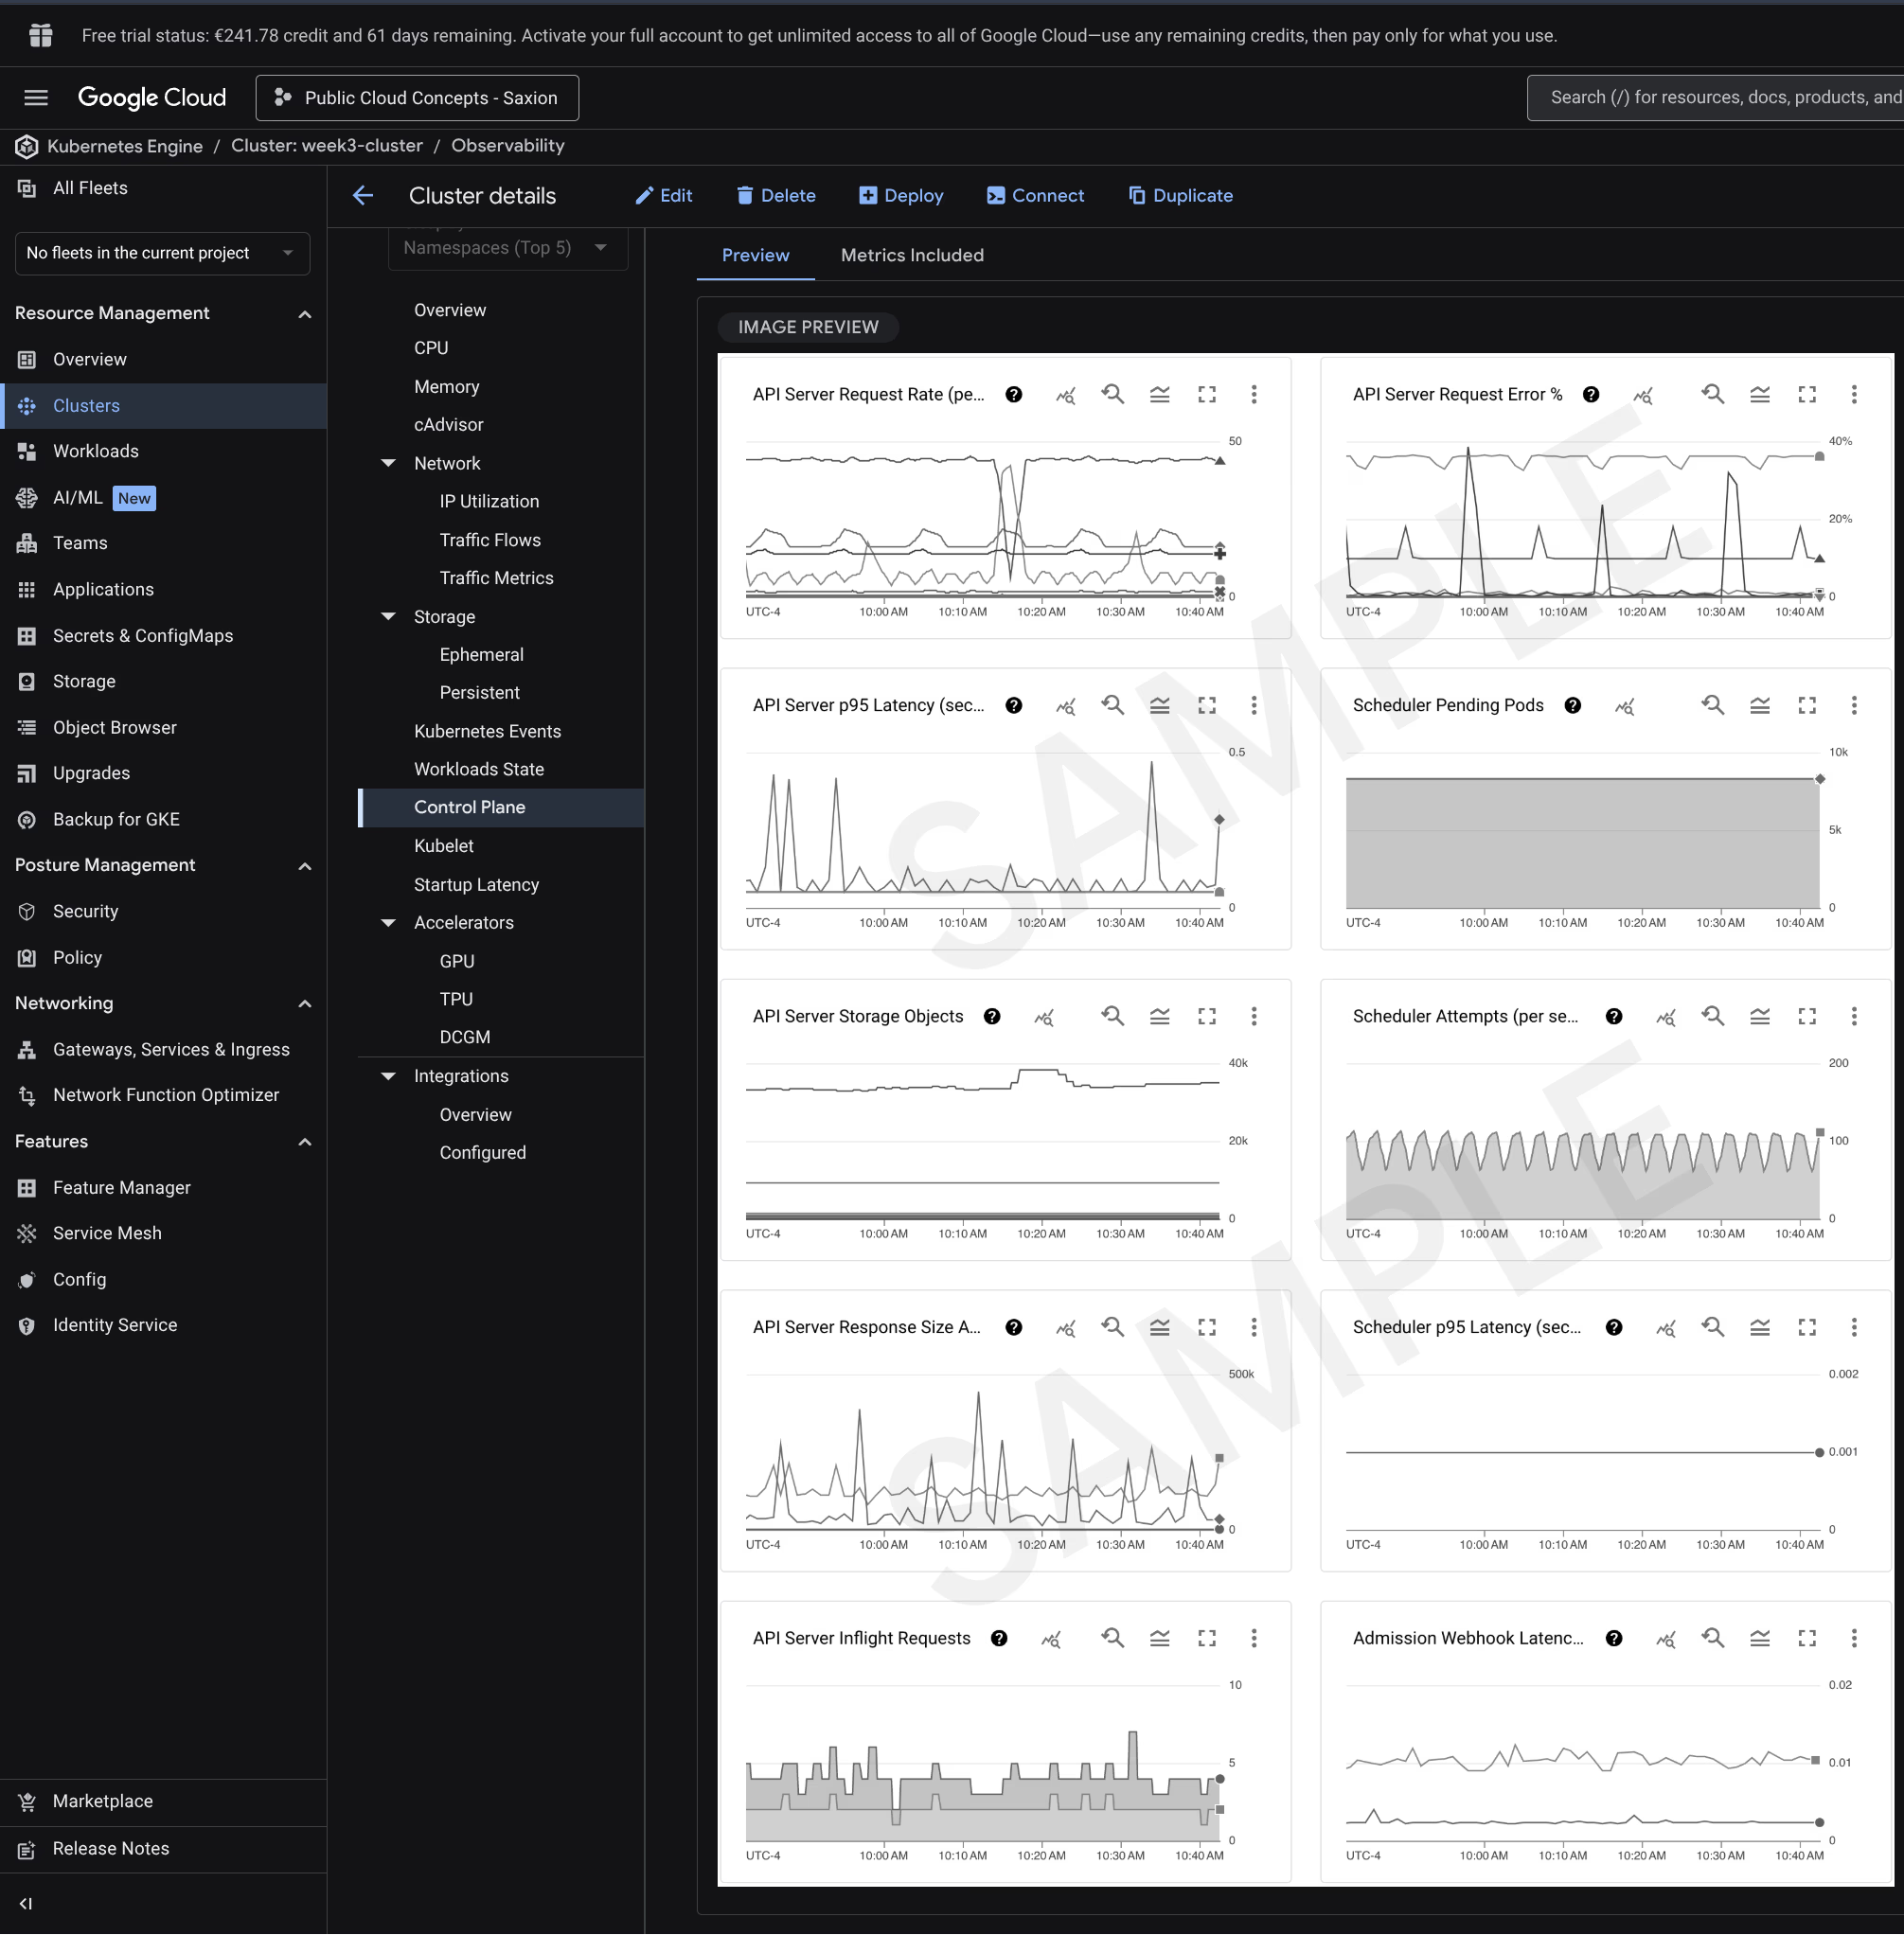
kubectl get pods -l app=public-cloud-concepts --show-labelsThis is also visible in the Google Cloud Console. In the Cloud Shell terminal the kubectl patch commands and the IP address are visible:
Argo CD and Flux CD
What is Argo CD?
Argo CD is a GitOps tool that continuously synchronises the Kubernetes cluster with what is in a Git repository. The idea behind GitOps is that Git is the single source of truth: the desired state of the cluster is stored as YAML files in Git. Argo CD monitors the cluster and continuously compares it to those files. If there is a difference, Argo CD automatically corrects it.
Argo CD has a web interface where you can see per application whether the cluster matches Git (Synced) or not (OutOfSync). You can synchronise manually or enable auto-sync. It also shows a tree view of all Kubernetes resources belonging to an application, including pods, services, and deployments.
In practice: you deploy Argo CD in your cluster, create an Application object pointing to a Git repository and a path within it, and Argo CD watches that path. When you commit a new image tag to a YAML file, Argo CD picks it up and updates the cluster.
What is Flux CD?
Flux CD does the same thing as Argo CD (GitOps, pull model), but works very differently under the hood. Flux consists of a set of Kubernetes controllers that you install in the cluster. There is no separate web interface. Everything Flux does is visible via kubectl.
Flux has separate controllers for different tasks:
- Source Controller watches Git repositories, Helm repositories, and OCI registries and downloads new versions.
- Kustomize Controller applies Kustomize overlays to what the Source Controller fetches.
- Helm Controller installs or updates Helm charts based on a HelmRelease object in Git.
- Notification Controller sends messages to Slack, Teams, or webhooks on events.
Because everything goes through Kubernetes objects, Flux integrates well into existing GitOps workflows and is easy to manage with CI/CD tools that already work with kubectl.
Comparison with GitHub Actions
| GitHub Actions | Argo CD | Flux CD | |
|---|---|---|---|
| Model | Push: pipeline actively pushes to the cluster | Pull: Argo CD fetches changes from Git | Pull: Flux controllers fetch changes |
| Trigger | Event in GitHub (push, PR) | Continuous polling, or webhook | Continuous polling, or webhook |
| Cluster access | Runner outside the cluster needs direct access | Argo CD runs inside the cluster itself | Flux runs inside the cluster itself |
| Drift detection | None, pipeline only runs on events | Automatic, corrects without trigger | Automatic, corrects without trigger |
| UI | No built-in Kubernetes UI | Full web interface | No UI, everything via kubectl |
| Suitable for | CI: building, testing, pushing images | CD: deploying and monitoring state | CD: fully automated environments |
When do you use which?
GitHub Actions is well suited for building images, running tests, and pushing to a registry. That is CI. For the deployment itself (CD), Argo CD and Flux CD are better choices, because they keep the cluster continuously in sync with Git and automatically fix deviations.
In a typical production setup you combine both: GitHub Actions builds the image and writes the new tag back to a YAML file in Git. Argo CD or Flux CD detects that change and deploys the new version to the cluster.
Choose Argo CD when you want a visual overview of what is running in the cluster and what the state is. Choose Flux when you want a purely declarative approach without an extra UI, or when you already work with Kustomize or complex Helm setups.