Assignment
The company TerramEarth (see the case description) wants to use monitoring and observability to gain better control over their IT processes. Setting up processes for proactive management of (hybrid) cloud environments is much more than installing a tool. The ITIL framework and DevOps provide best practices to align with IT processes in a changing business environment.
5.1 Monitoring with Prometheus, Loki, Promtail, and Grafana
Installation
Create a Kubernetes cluster in Google Cloud. Use the Standard option instead of the automated Autopilot cluster; the Autopilot cluster does not work for this assignment.
Study the script
setup-loki-prometheus-grafanaand the accompanyingvalues.yamlfiles. Determine which usernames and passwords are used (or adjust them), and which ports are used.Connect to the cluster and run the script
setup-loki-prometheus-grafana. Make sure the accompanyingvalues.yamlfiles are available.The last line of the script installs the ingress controller. Verify with the following command that this pod is active. Wait if necessary until the pod has the status
Running:kubectl get pods --namespace ingress-nginx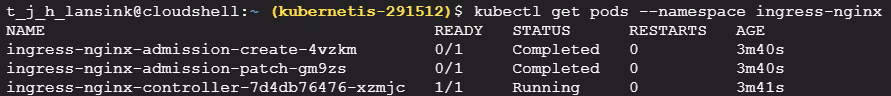
Create an Ingress for the Grafana service (port 443) in the
grafananamespace. The beginning of thegrafana-ingress.yamlfile looks as follows: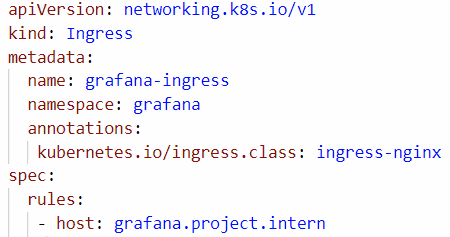
Look up the IP address of the Ingress. Update the
hostsfile on your PC so that the namegrafana.project.internpoints to the corresponding IP address.Open the Grafana application in your browser via
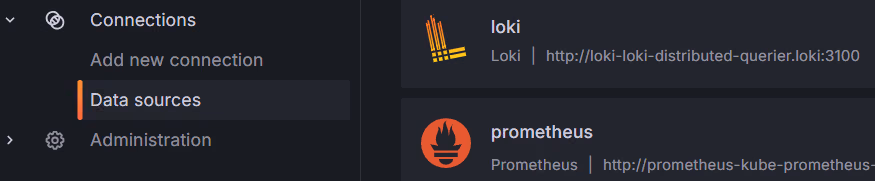
https://grafana.project.intern. After logging in, check the two data sources: Loki and Prometheus.Select a data source, scroll down, and click Test to verify the connection works.
Setting up monitoring
Run your own application from week 1 and 2 in the Kubernetes cluster.
Determine what you want to monitor (from logs or metrics). Go to Dashboards and create or import the appropriate dashboards for the desired monitoring. Explain which dashboards are valuable to you.
Create an architecture diagram showing the relationship between the installed components: Prometheus, Loki, Promtail, and Grafana. Make clear what the role of each component is.
Are there other tools commonly used for monitoring a Kubernetes cluster?
5.2 SIEM and SOAR
- Review the sources from the course materials and describe the concepts SIEM and SOAR. Relate these to the ITIL and DevOps frameworks and the TerramEarth case study. Use the sources in your answer (paraphrase or cite).
5.3 Case Study: TerramEarth
Study the TerramEarth case. Analyse which products (at least 2) they can deploy for Monitoring and/or Observability.
For each of the following processes, provide concrete examples (at least 2) of what you would measure and how you would structure this at tactical and operational level:
- Problem Management
- Monitoring & Event Management