Solution
GKE Standard cluster set up with a modern monitoring stack: Loki (SingleBinary), Grafana Alloy, and Prometheus via kube-prometheus-stack.
Deviations from the school material
The script from school contained some mistakes and outdated components. When running it I got deprecation warnings in my terminal, so I looked into whether I could fix that myself. I could.
| School script | My version | Reason |
|---|---|---|
grafana/loki-distributed | grafana/loki (SingleBinary) | loki-distributed chart is deprecated; functionality is now in the main chart |
grafana/promtail | grafana/alloy | promtail is deprecated |
standalone grafana/grafana release | bundled in kube-prometheus-stack | standalone chart is deprecated |
storageClass: managed-csi | standard-rwo | Azure-specific, does not work on GKE |
The original script is in static/docs/week-5/bestanden/opdracht/, my version in static/docs/week-5/bestanden/uitwerking/.
Charts used:
| Component | Namespace | Chart |
|---|---|---|
| Loki | loki | grafana/loki (SingleBinary) |
| Log collector | alloy | grafana/alloy |
| Prometheus + Grafana | prometheus | prometheus-community/kube-prometheus-stack |
| Ingress | ingress-nginx | ingress-nginx/ingress-nginx |
Sources:
| Topic | Source |
|---|---|
| Loki monolithic (SingleBinary) | grafana.com/docs/…/install-monolithic/ |
| Loki schema configuration | grafana.com/docs/loki/latest/operations/storage/schema/ |
| Configuring Alloy on Kubernetes | grafana.com/docs/alloy/latest/configure/kubernetes/ |
| Alloy example scenarios | github.com/grafana/alloy-scenarios |
Step 1: Create Kubernetes cluster
Why Standard and not Autopilot?
Autopilot restricts DaemonSets, blocks containers that require elevated privileges by default, and requires resource requests for every pod. That conflicts with the monitoring stack:
- Alloy runs as a DaemonSet with access to
/var/log/podson the host - Prometheus node-exporter requires elevated access to host metrics
- ingress-nginx requires port configuration that Autopilot does not always allow
With Standard you simply have full control over node configuration, DaemonSets, and workloads requiring elevated privileges.
gcloud container clusters create week5-cluster \
  --region=europe-west4 \
  --node-locations=europe-west4-a,europe-west4-b \
  --project=project-5b8c5498-4fe2-42b9-bc3 \
  --machine-type=e2-medium \
  --num-nodes=2 \
  --disk-size=50 \
  --disk-type=pd-balanced \
--release-channel=regular| Flag | Value | Note |
|---|---|---|
--region | europe-west4 | Region closest to the Netherlands |
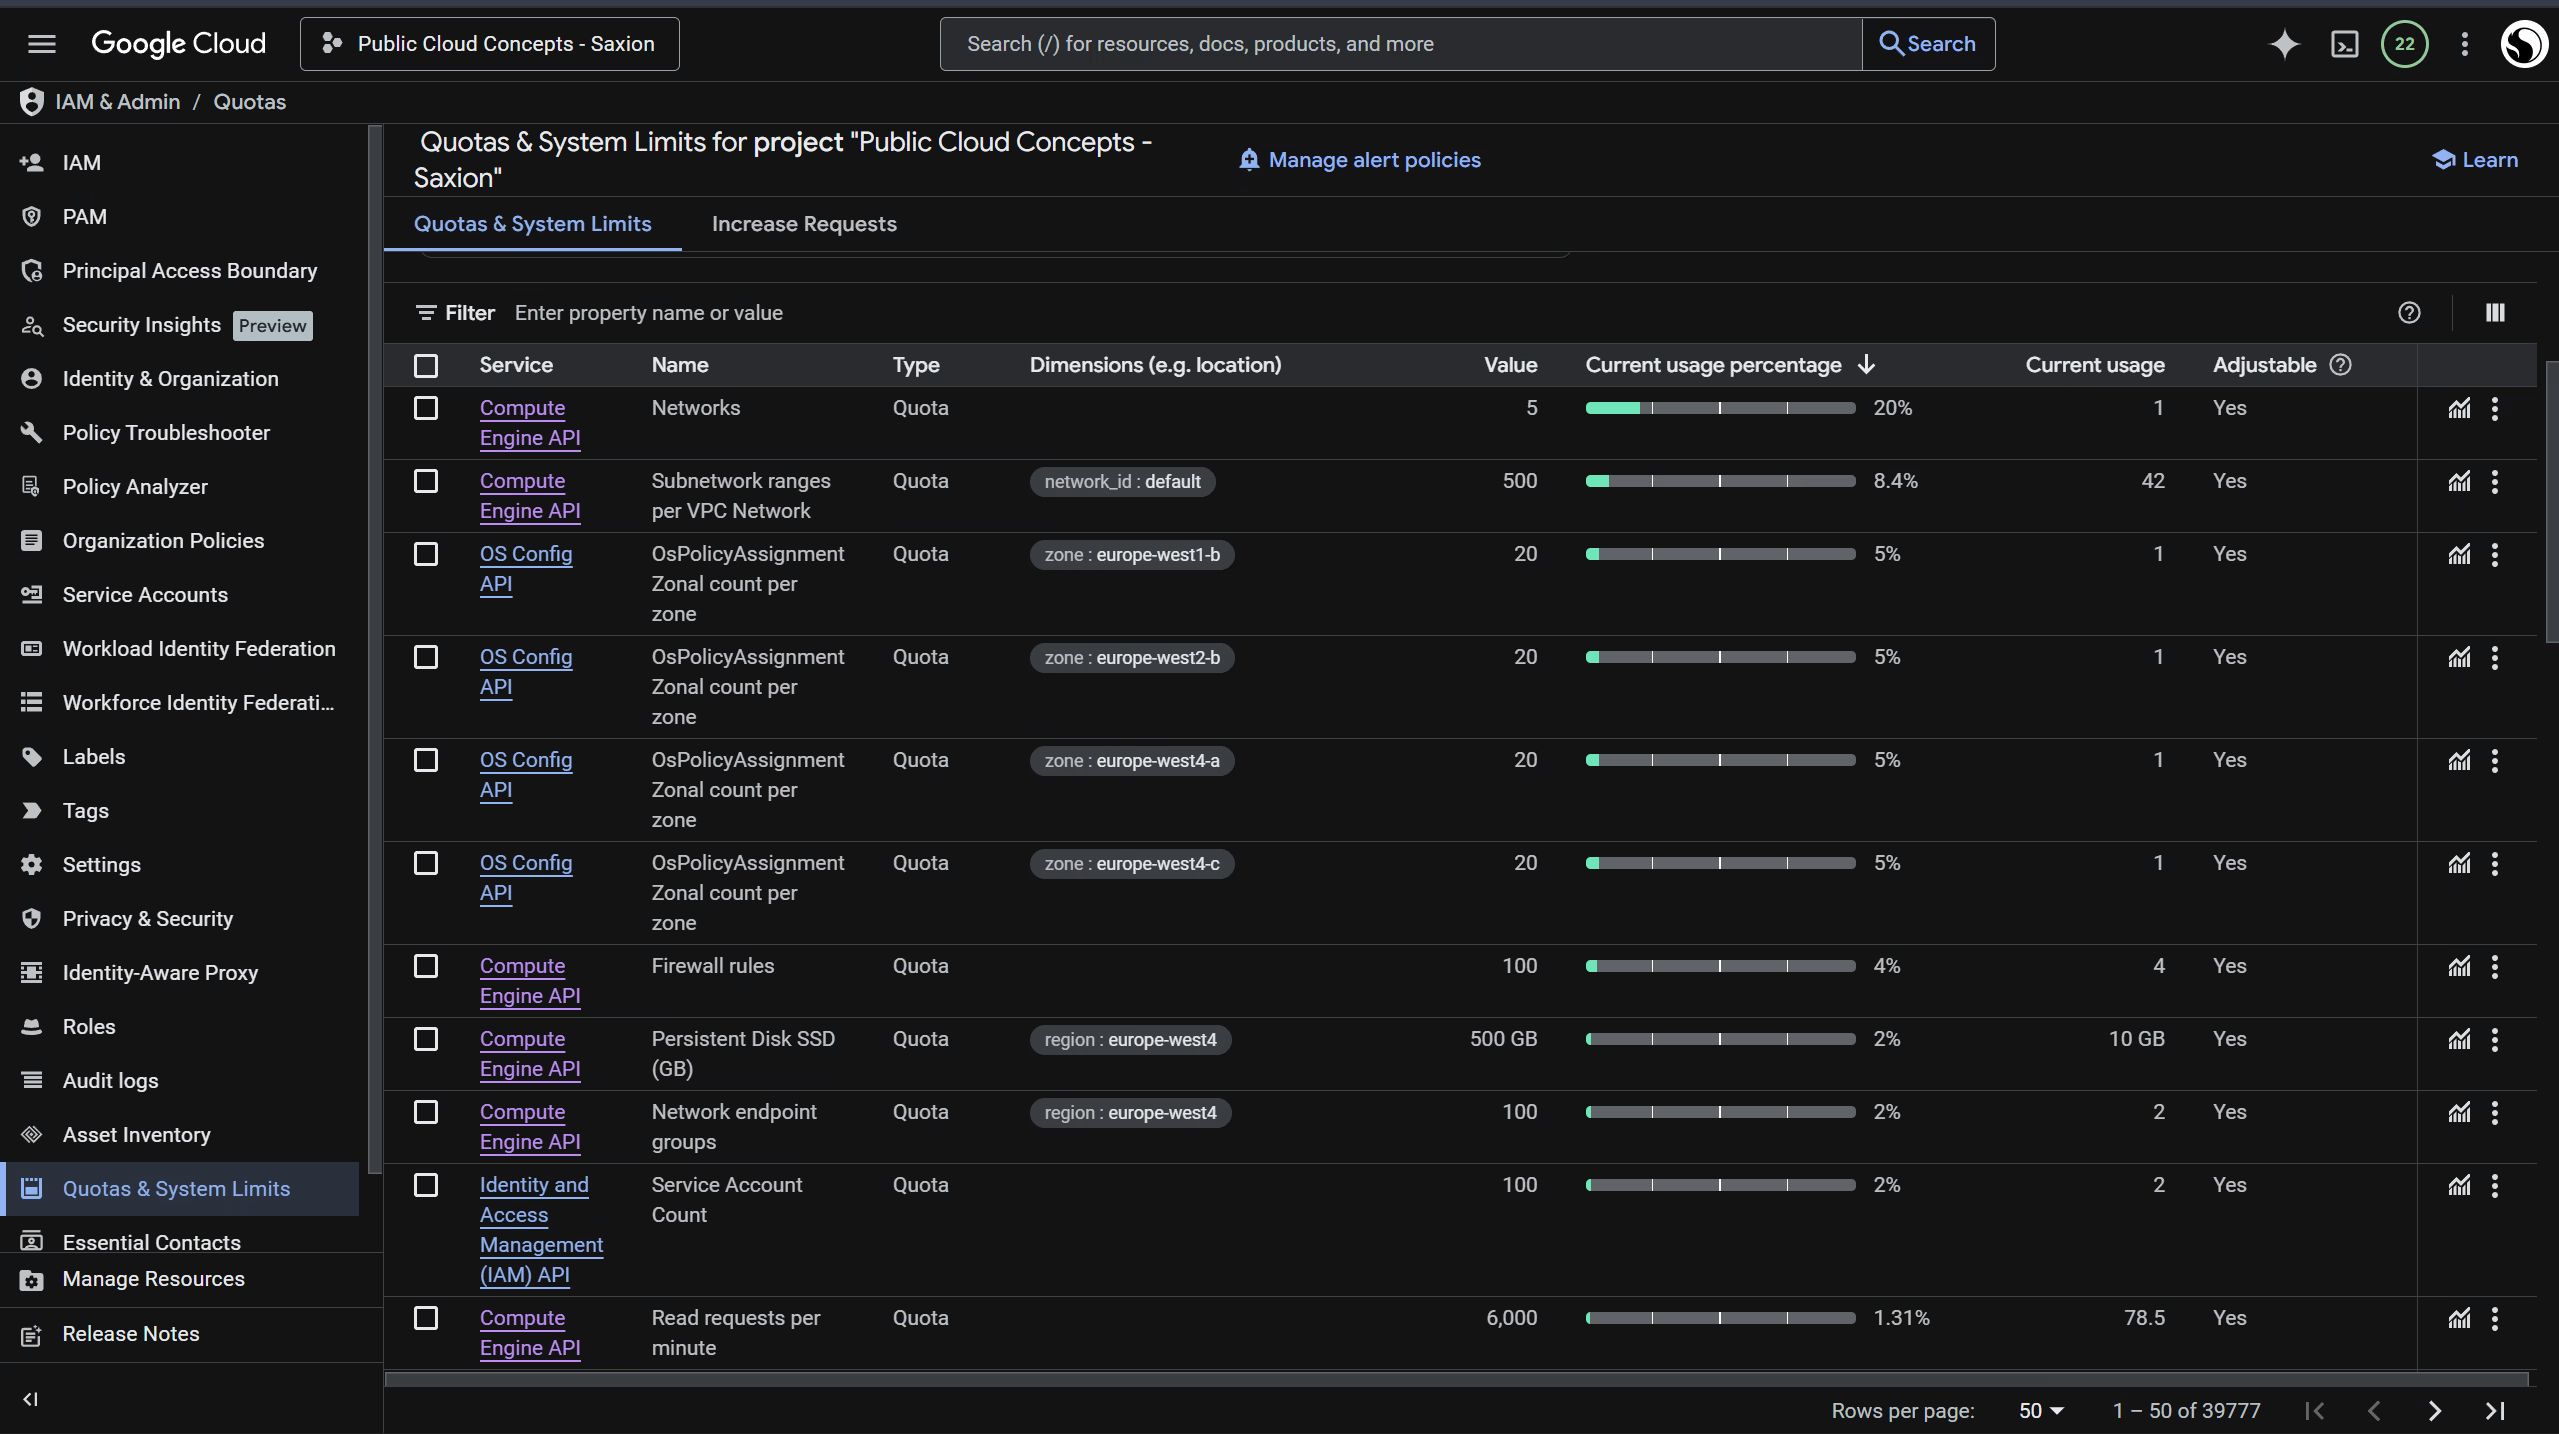
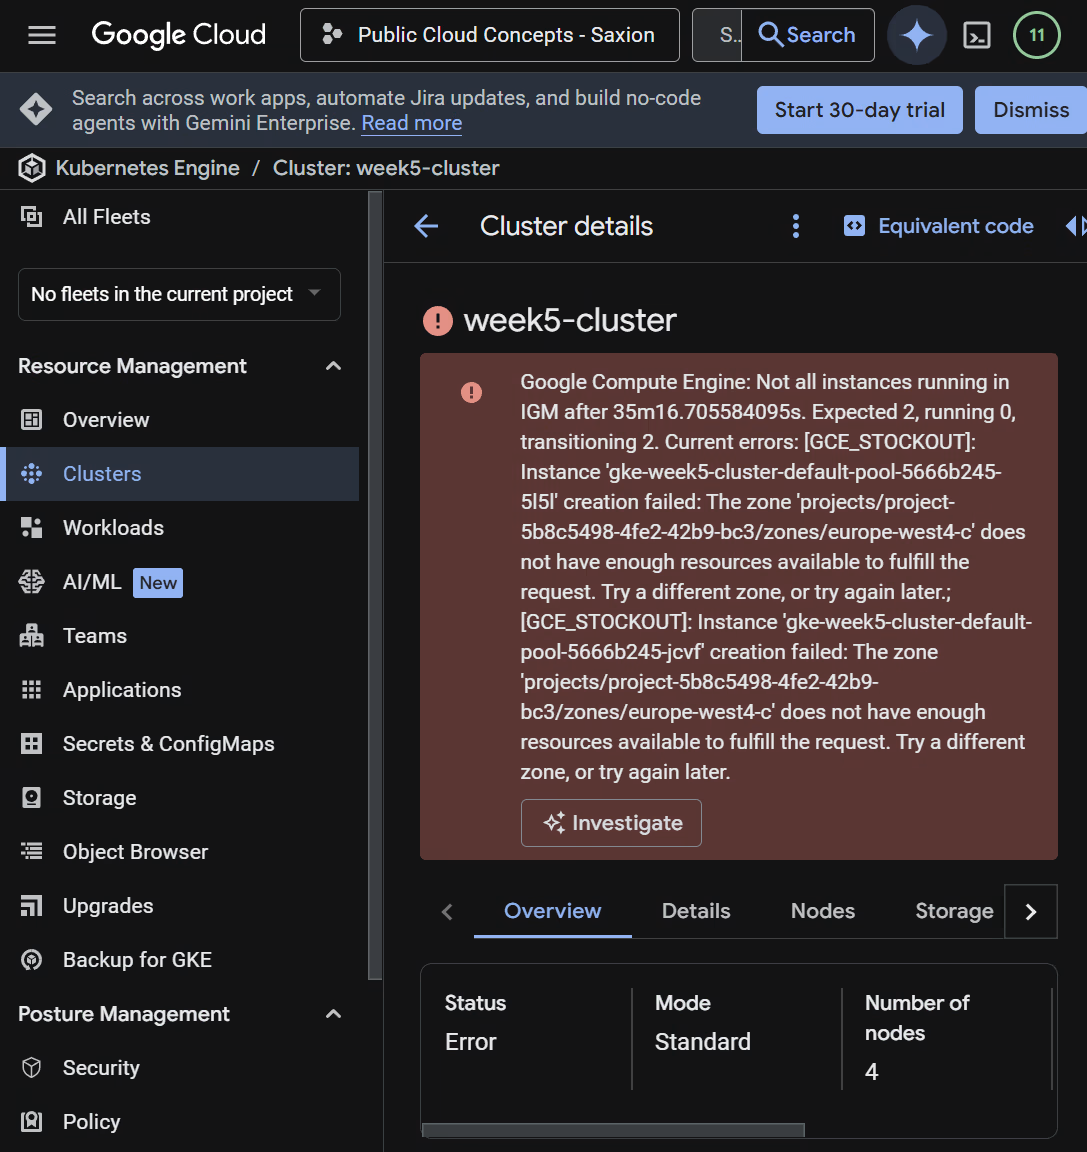
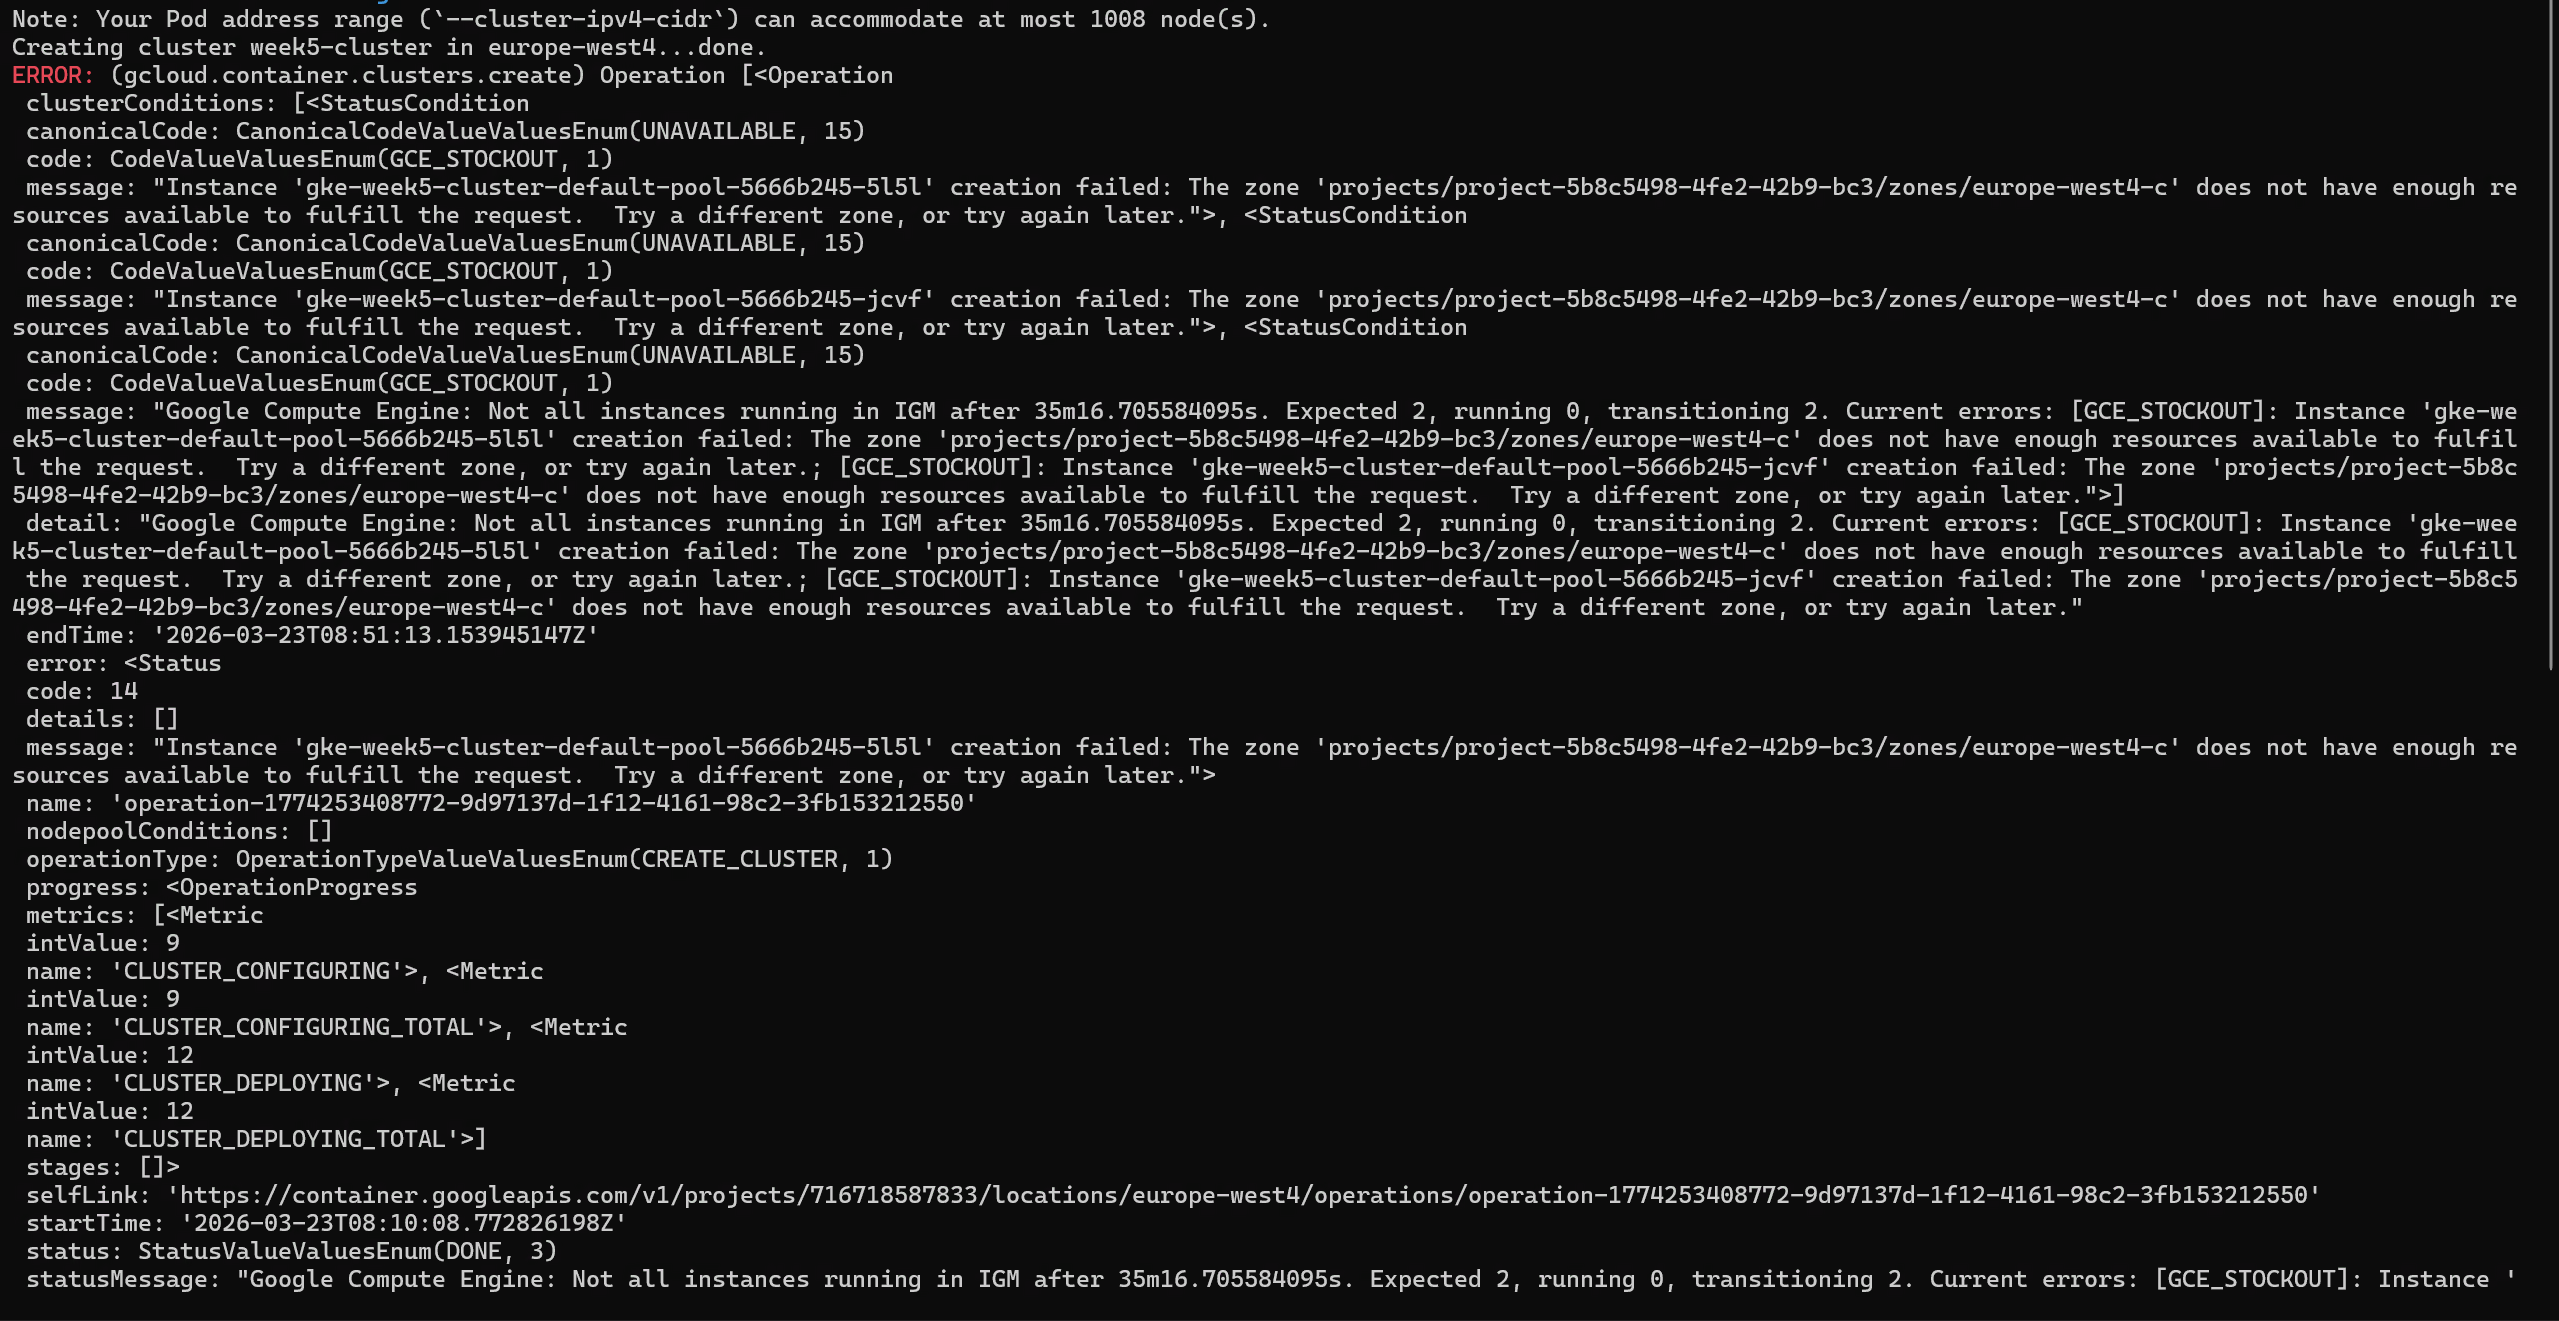
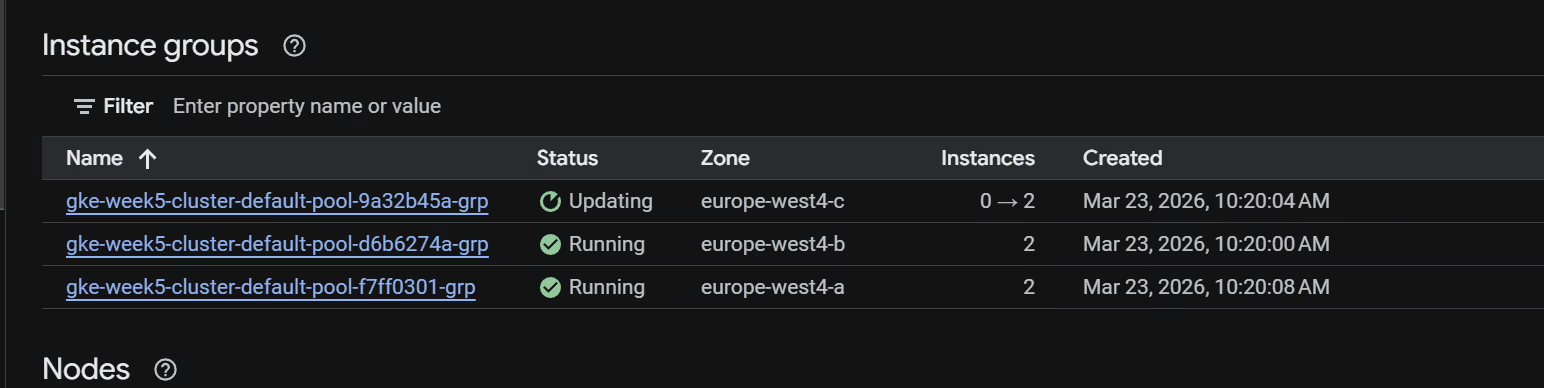
--node-locations | europe-west4-a,europe-west4-b | Zones a and b only; zone-c had continuous GCE_STOCKOUT errors |
--machine-type | e2-medium | 2 vCPU, 4GB RAM, sufficient for SingleBinary Loki + Prometheus + Grafana |
--num-nodes | 2 | 2 nodes per zone × 2 zones = 4 nodes total |
--disk-size | 50 | 4 × 50GB = 200GB SSD, well within the 500GB quota |
--disk-type | pd-balanced | SSD (balanced), better I/O for Prometheus TSDB writes |
--release-channel | regular | Stable GKE versions with automatic upgrades |
Student quota (disk): Default GKE settings (100GB per node) would require 4 × 100GB = 400GB SSD. With --disk-size=50 it comes to 4 × 50GB = 200GB SSD, well within the 500GB quota.
Student quota (RAM): e2-medium (4GB RAM per node) doubles the RAM compared to e2-small. GCP does not count RAM as a separate quota; the limit is on VM instances and CPUs, both well within student limits.
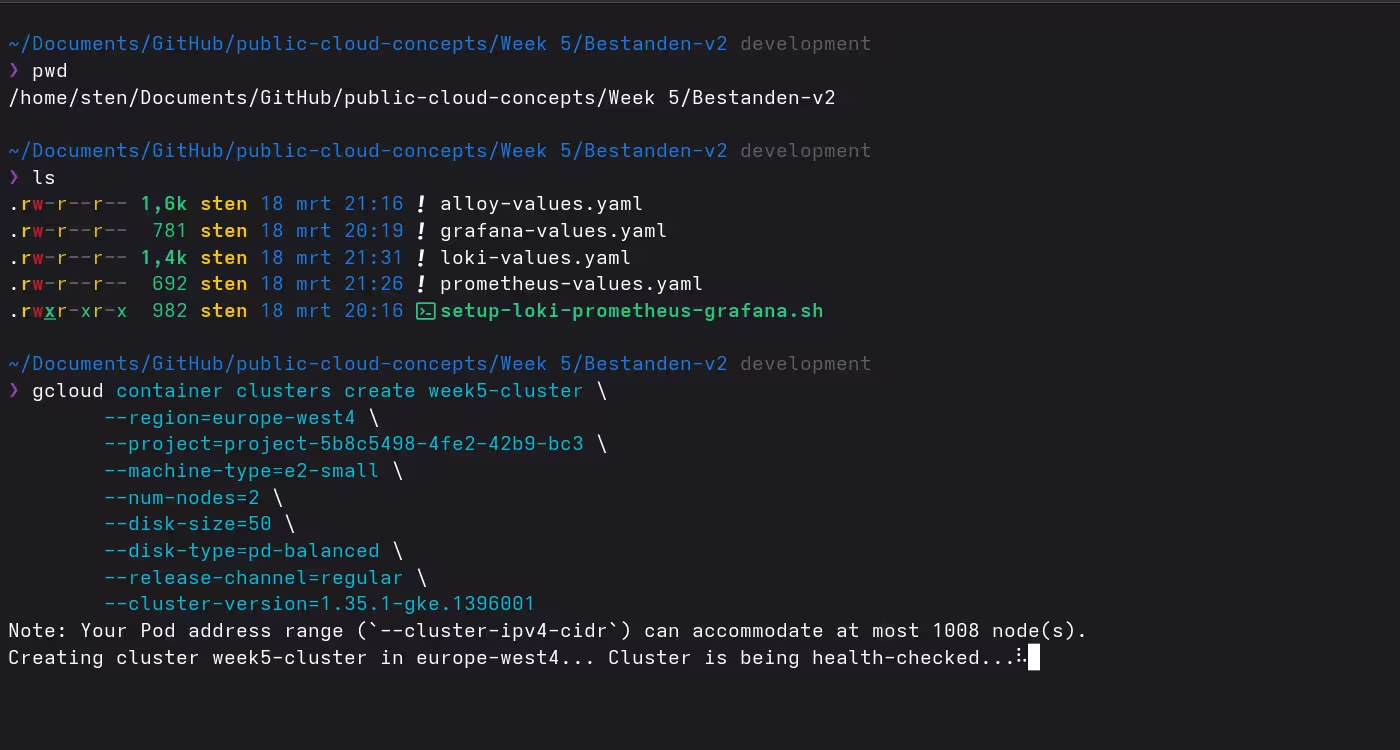
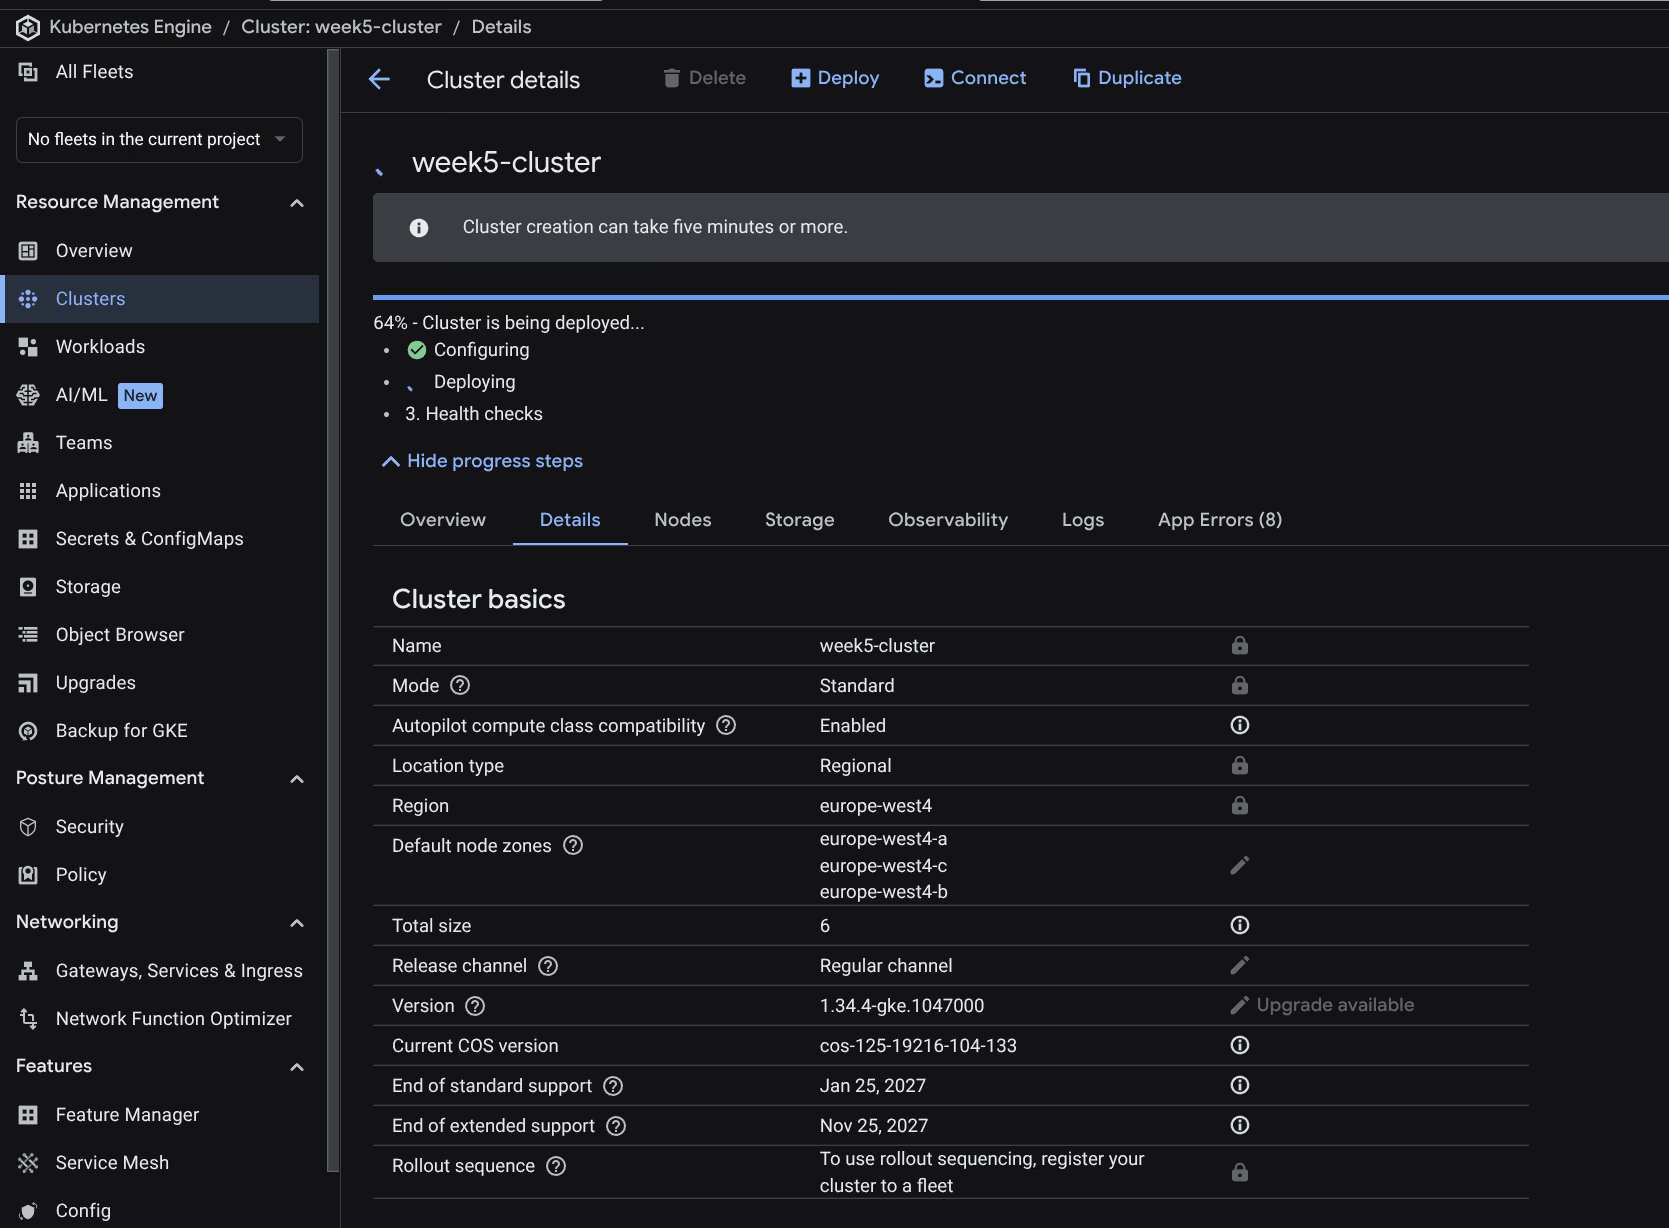
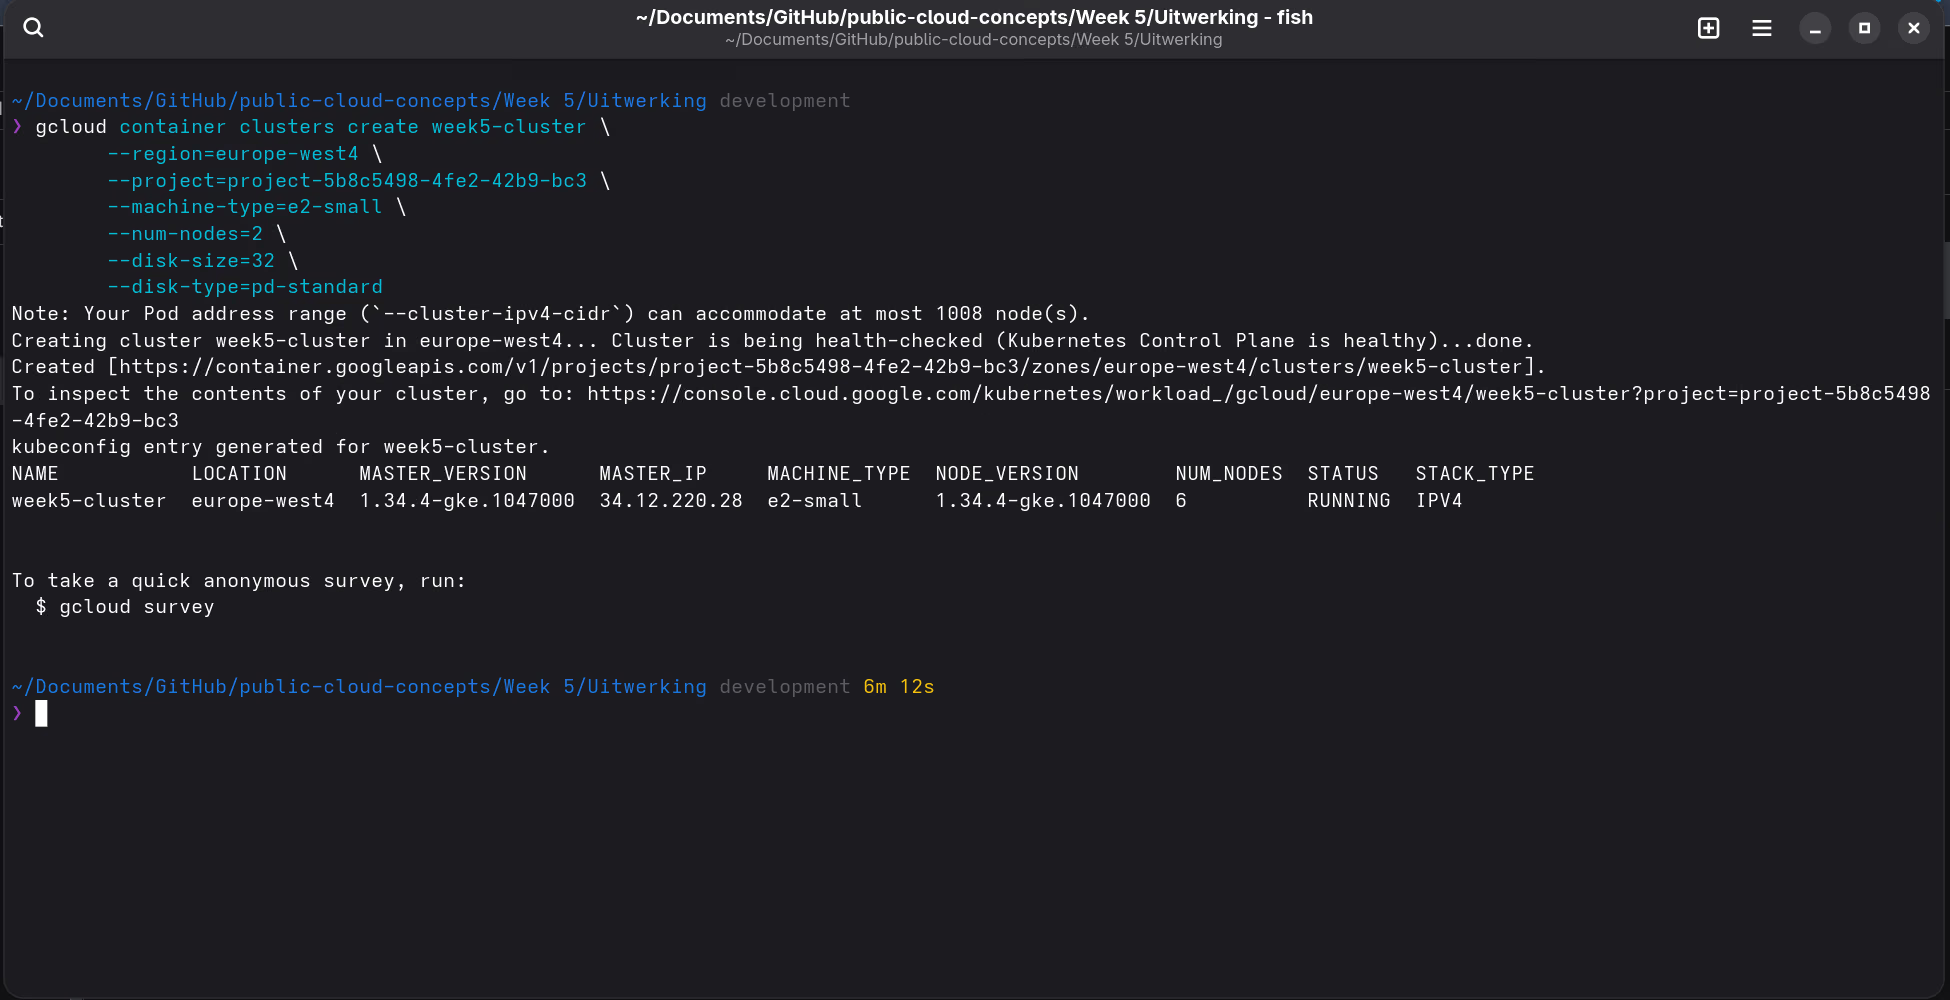
This cluster cost me almost two weeks.
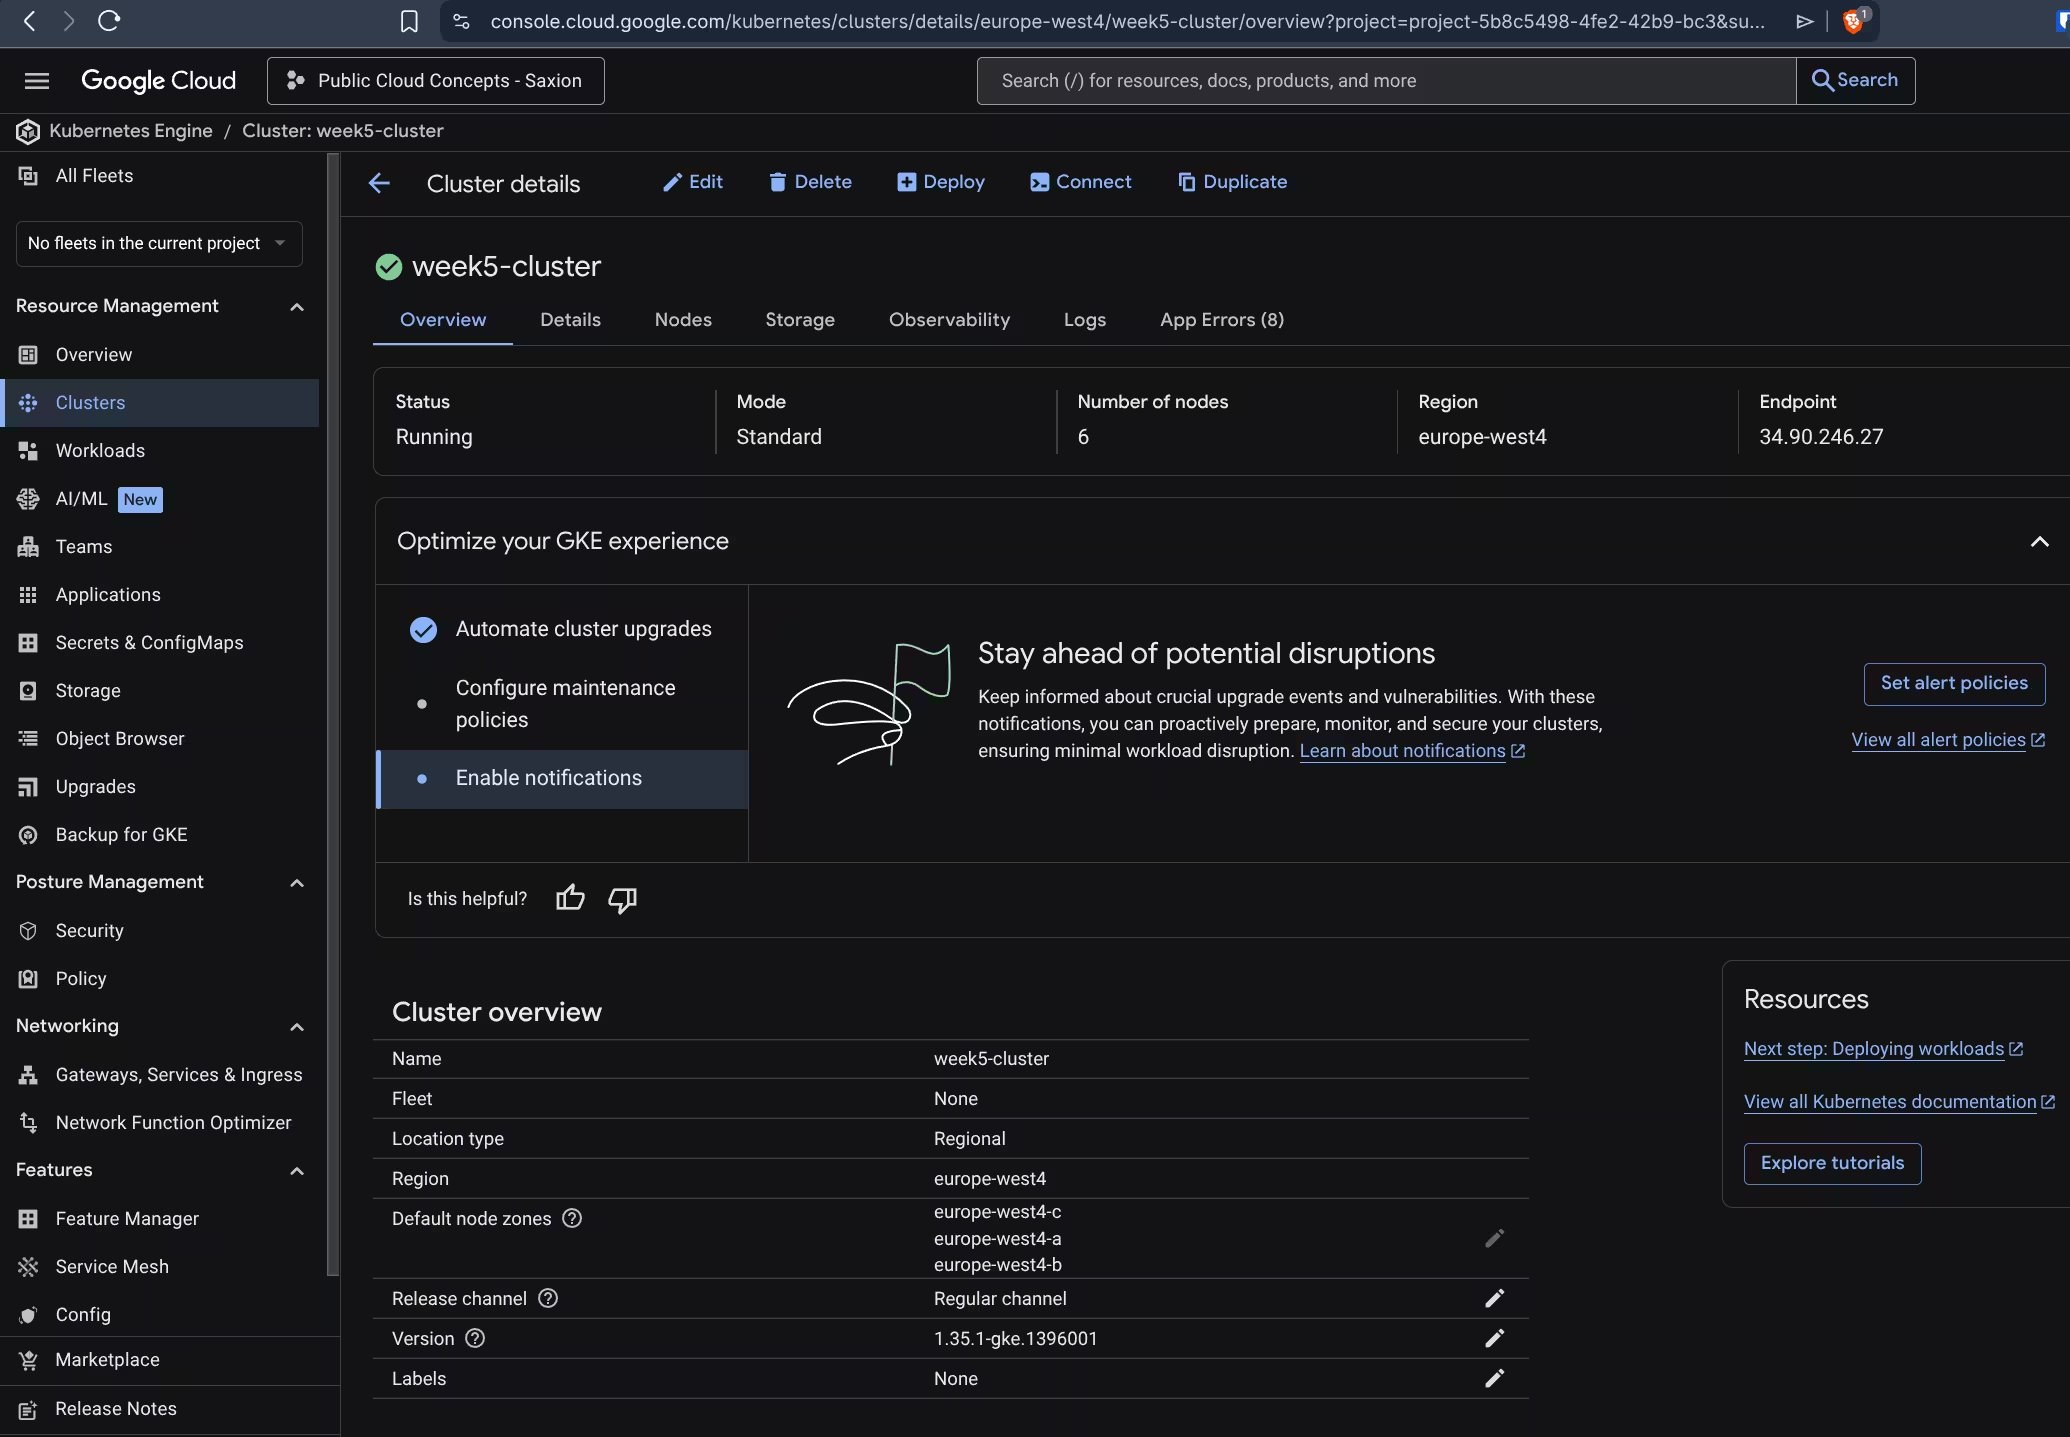
I kept getting a GCE_STOCKOUT error in zone europe-west4-c - the zone simply had no capacity available. My quotas looked fine, so I had no idea what was causing it. I looked into it together with a few classmates, but nobody could explain it directly.
The solution was to exclude zone-c with --node-locations=europe-west4-a,europe-west4-b. Zones a and b had no problems, zone-c kept hanging. For a monitoring stack two zones are more than enough.
helm, kubectl, and gcloud are available there by default, no local installation needed.After installing the auth plugin in Cloud Shell:
gcloud components install gke-gcloud-auth-plugin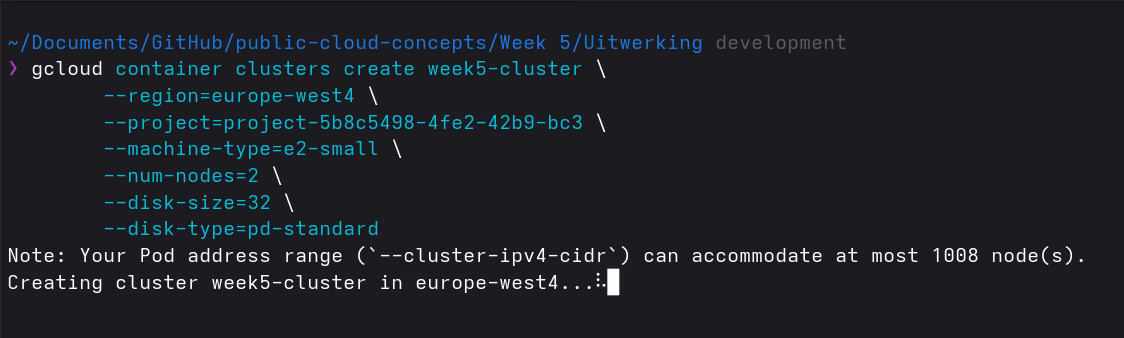
Step 2: Connect to the cluster
Connecting in Google Cloud Shell:
gcloud container clusters get-credentials week5-cluster \
  --region=europe-west4 \
  --project=project-5b8c5498-4fe2-42b9-bc3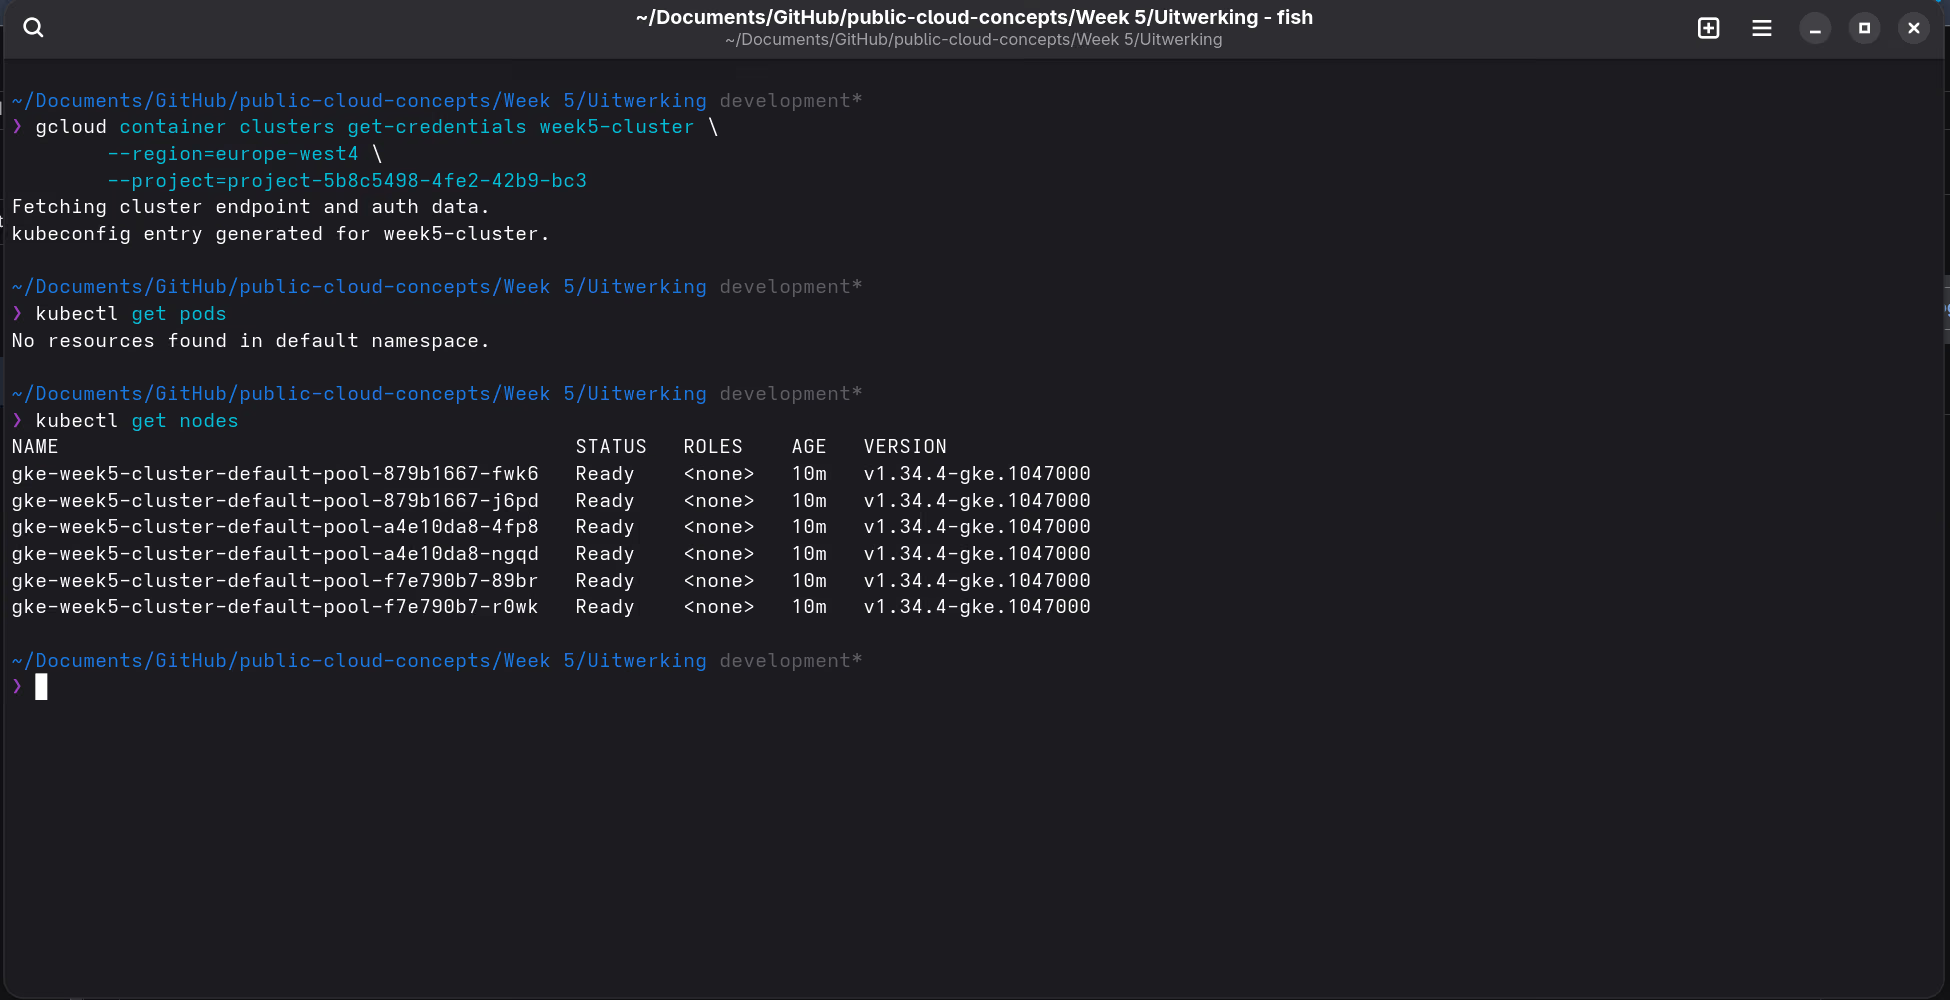
Step 3: Deploy the stack
Clone the repository in Cloud Shell (or update it if it already exists):
# First time
git clone https://github.com/Stensel8/public-cloud-concepts.git
cd public-cloud-concepts

# Already cloned before
cd public-cloud-concepts && git pull
Then run the script:
cd static/docs/week-5/bestanden/uitwerking
bash setup-loki-prometheus-grafana.sh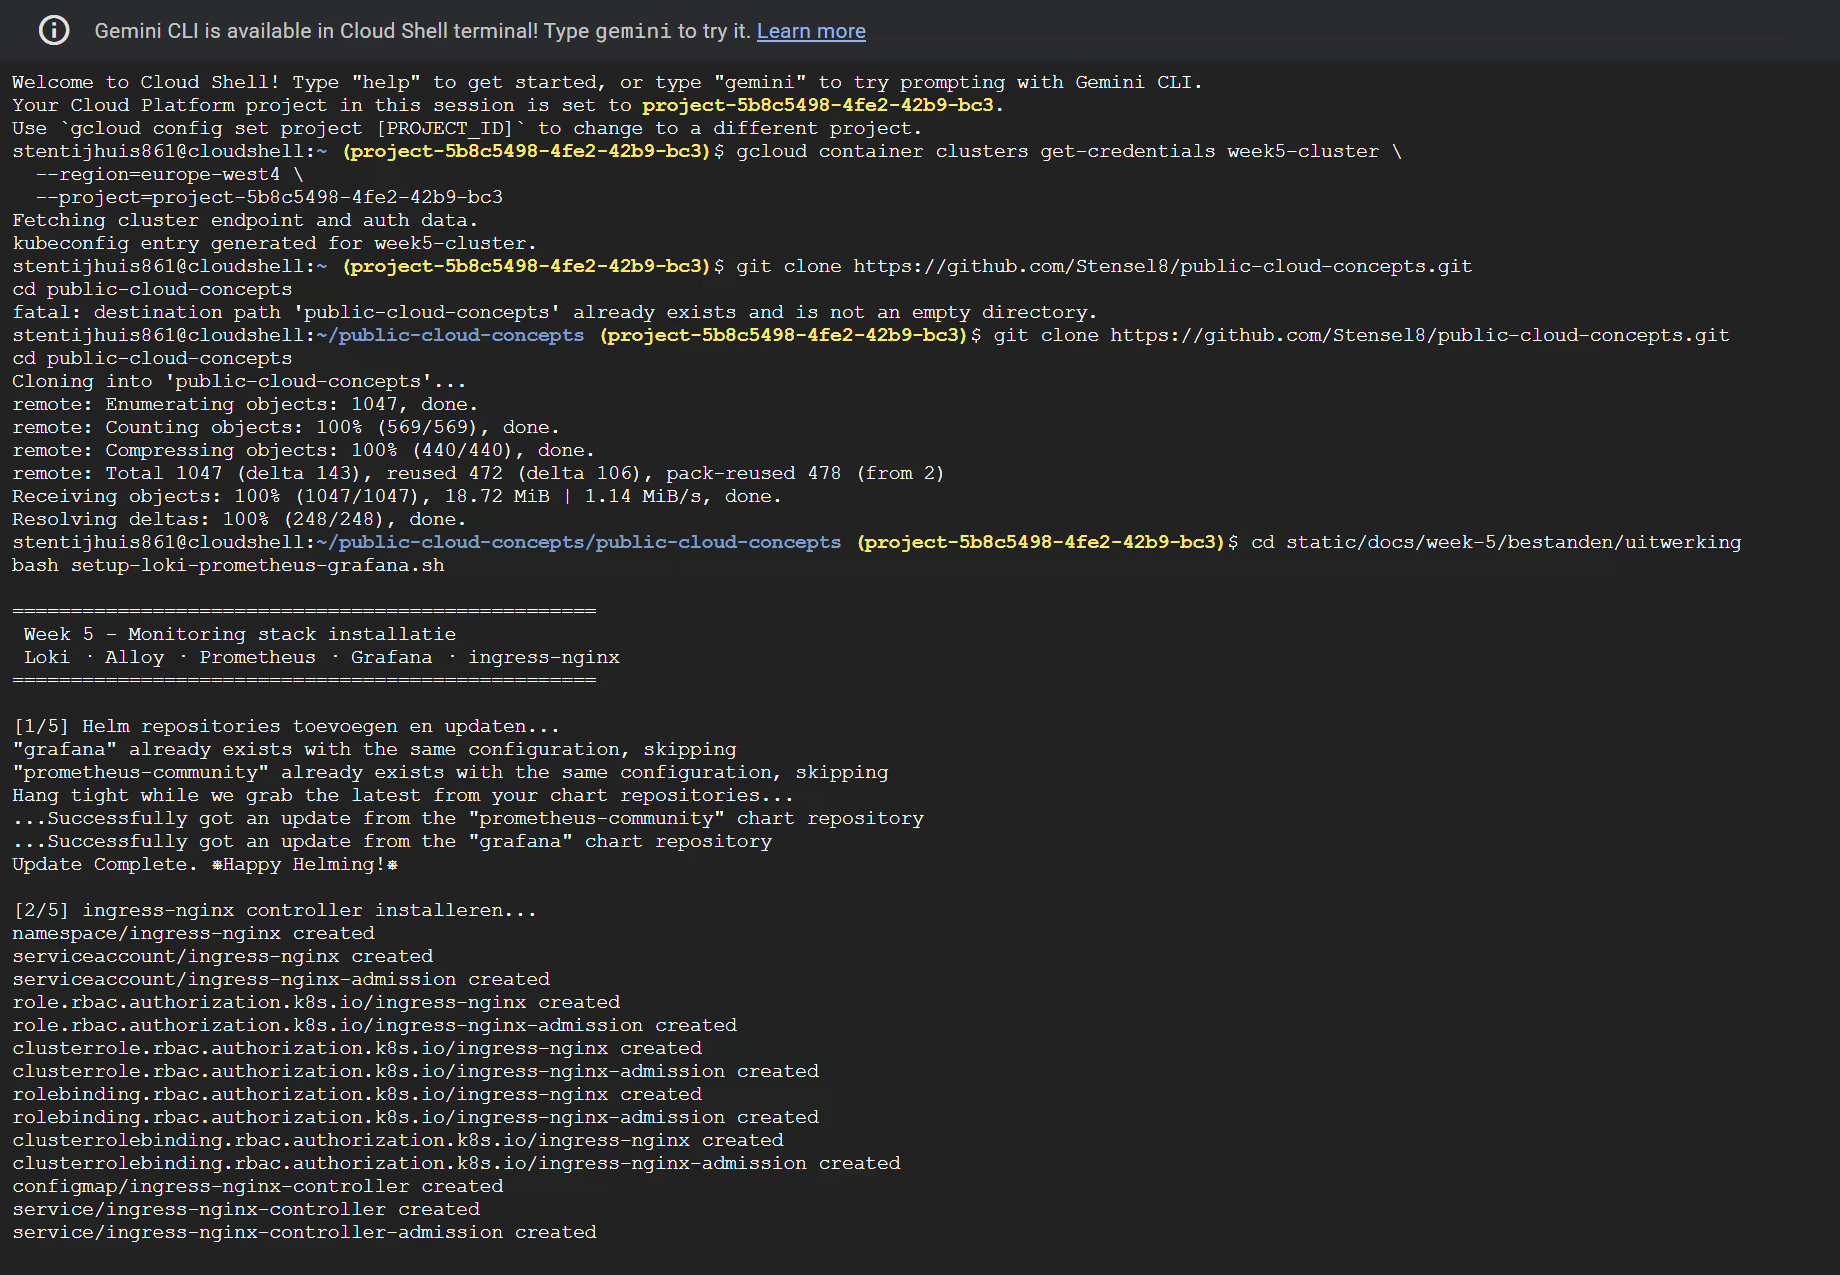
The script installs the stack in five steps: adding Helm repos, ingress-nginx (with kubectl wait), Loki, Alloy, Prometheus + Grafana.
Why ingress-nginx first?
The kube-prometheus-stack creates a Grafana Ingress object immediately during installation. The ingress-nginx controller validates that object via a webhook; if ingress-nginx is not yet running the Helm installation fails with a webhook error. By installing ingress-nginx first and waiting until the controller is Ready, this is prevented.
loki-values.yaml
The grafana/loki chart requires an explicit schemaConfig, otherwise Helm throws a hard error:
Error: You must provide a schema_config for Loki.Choosing a deployment mode
The grafana/loki chart supports three deployment modes. The choice depends on cluster size:
| Mode | Pods | When to use | Memcached caches |
|---|---|---|---|
| SingleBinary | 1 | Dev, labs, single user | Pointless (everything internal) |
| SimpleScalable | 3 (read / write / backend) | Medium-sized teams, staging | Useful |
| Distributed | 7+ (each component separate) | Large production, high load | Essential |
Distributed is not always better. The principle is that read and write paths scale independently, but if you end up with 1 replica per component you only add network hops and memory overhead. On a cluster of 4× e2-medium nodes Distributed is simply wasteful.
SimpleScalable sounds like the logical middle ground, but it requires an object storage backend (GCS, S3, or MinIO). Filesystem storage is the simplest option in a learning environment, but it is not supported in SimpleScalable mode. This produces the following error during helm install:
Error: Cannot run scalable targets (backend, read, write) or distributed targets without an object storage backend.SimpleScalable would be a good fit if object storage is already available (e.g. a GCS bucket), but setting that up adds significant overhead for a lab environment.
SingleBinary is therefore the right choice here: one pod, filesystem storage, no object storage required. The memcached caches (chunks-cache, results-cache) are pointless in this mode and are disabled. Everything runs in-process, so an external caching service only adds overhead.
grafana/loki-distributed chart, which is now deprecated. That does not mean distributed Loki is deprecated; the functionality is now in the main chart (grafana/loki). For a learning environment using filesystem storage, SingleBinary is the correct choice.The full file is on GitHub. Other choices:
storageClass: standard-rwo: GKE-compatible; the school script usedmanaged-csi, which is Azure-specificminio.enabled: false: filesystem storage is sufficient for this setupretention_period: 336h(14 days) + compactor withretention_enabled: true: logs are actually deleted after 14 days
alloy-values.yaml
Alloy replaces Promtail and uses the Alloy flow language. The config does the same as Promtail, but declaratively:
- Discover Kubernetes pods (
discovery.kubernetes) - Add labels based on pod metadata (
discovery.relabel) - Read logs from the pods (
loki.source.kubernetes) - Forward logs to Loki (
loki.write)
The grafana/loki chart places an nginx gateway in front of the Loki pod by default. All Loki URLs go through that gateway:
# Alloy to Loki (push)
http://loki-gateway.loki.svc.cluster.local/loki/api/v1/push

# Grafana datasource
http://loki-gateway.loki.svc.cluster.local
Two valid approaches: The official Grafana tutorial uses the
grafana/k8s-monitoringchart (a ready-made bundle). For more insight into what happens under the hood I chose the standalonegrafana/alloychart.
prometheus-values.yaml
Grafana is built into kube-prometheus-stack (grafana.enabled: true), so no separate grafana/grafana chart is needed. Prometheus is set to 1 replica; the monitoring stack is RAM-intensive and multiple replicas are not needed for this setup.
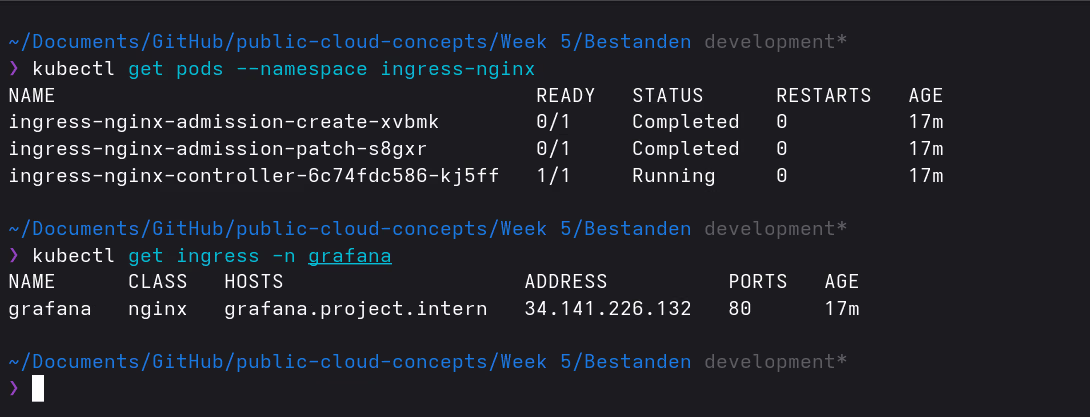
Step 4: Get the IP address
kubectl get ingress -n prometheus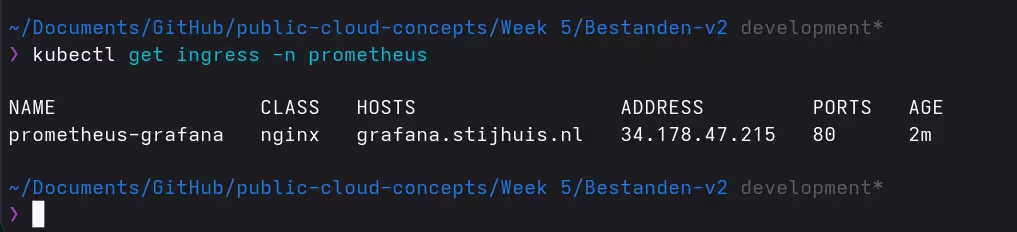
Step 5: Set up DNS
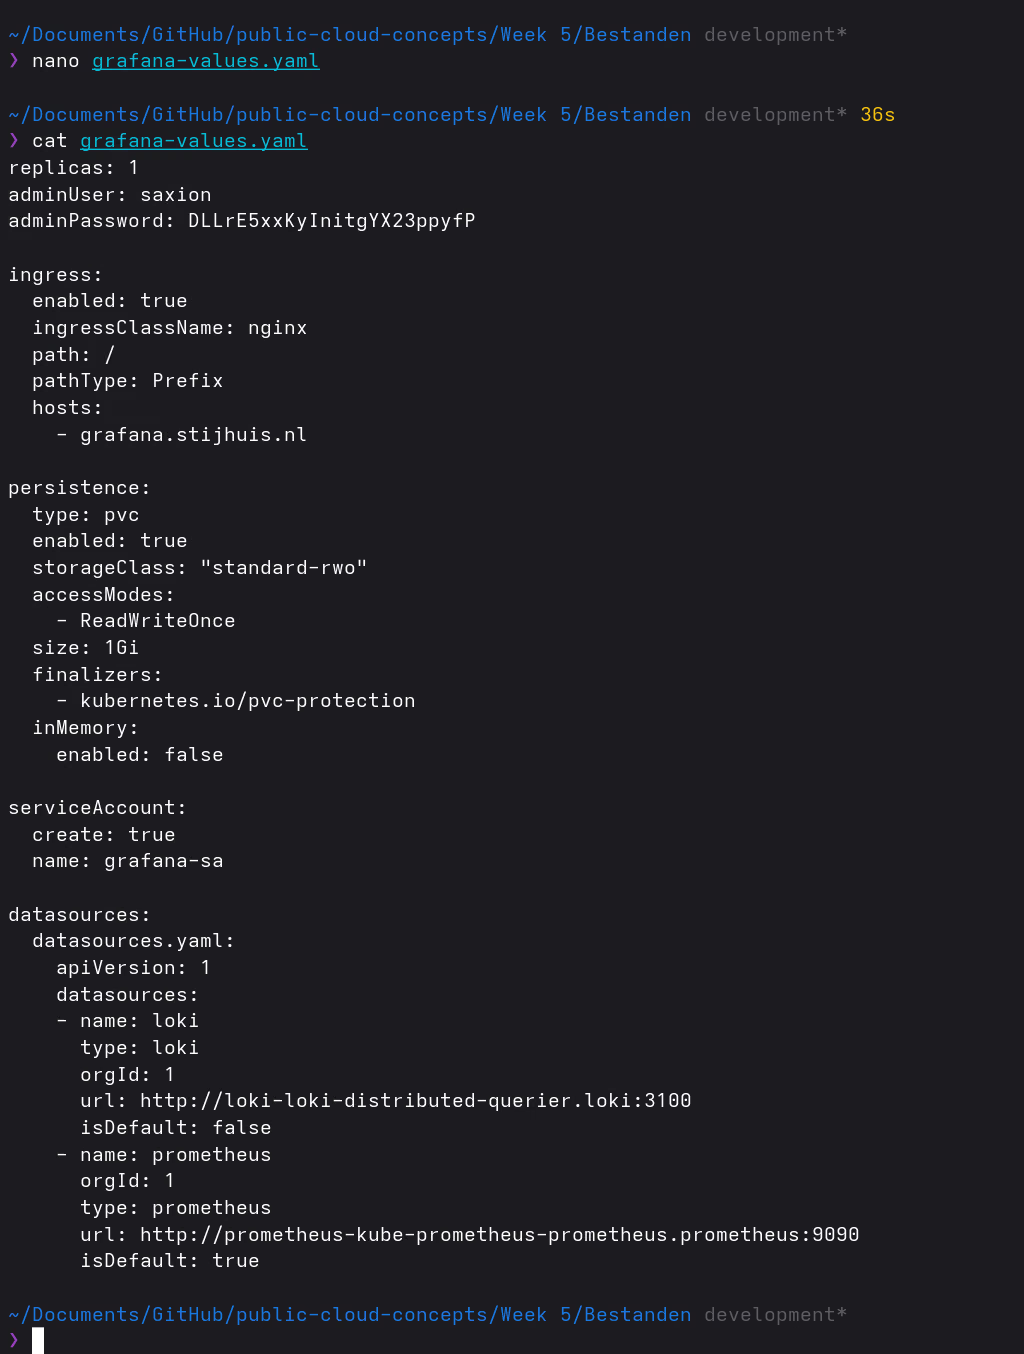
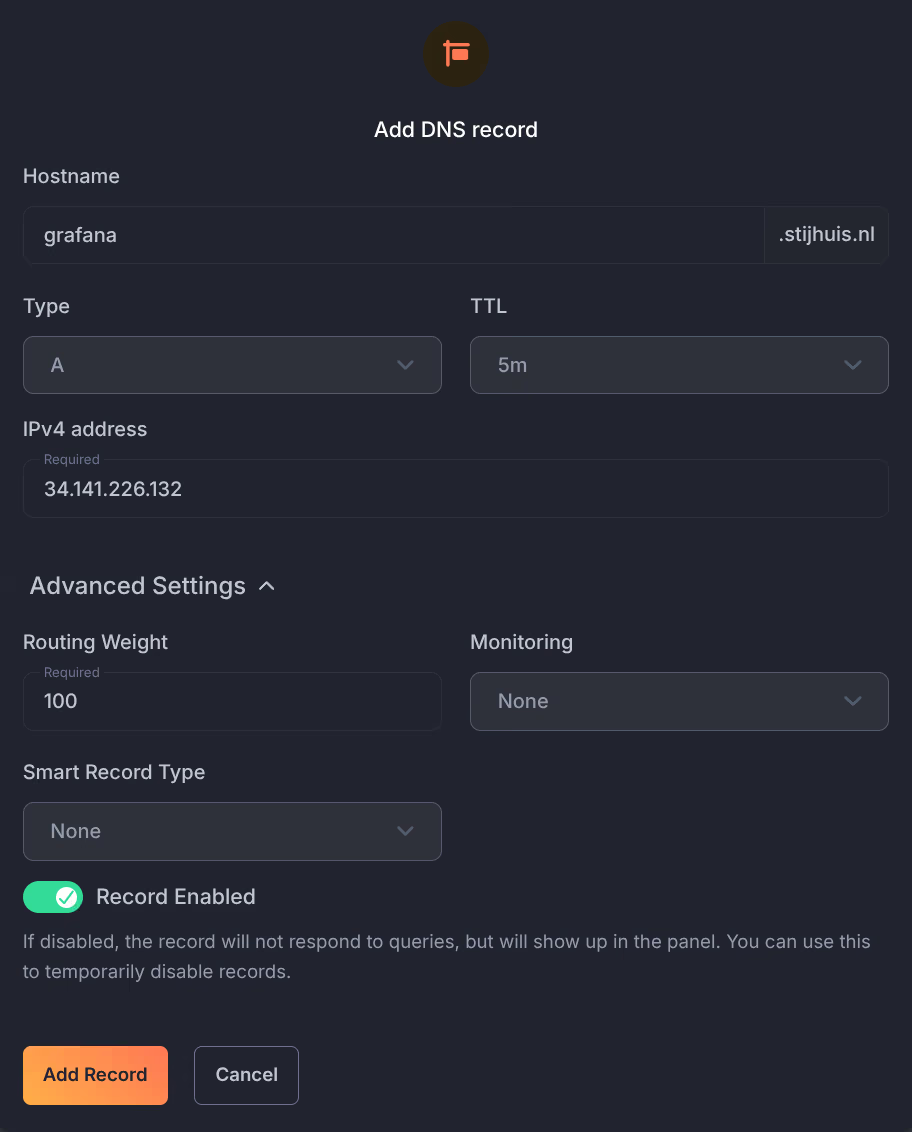
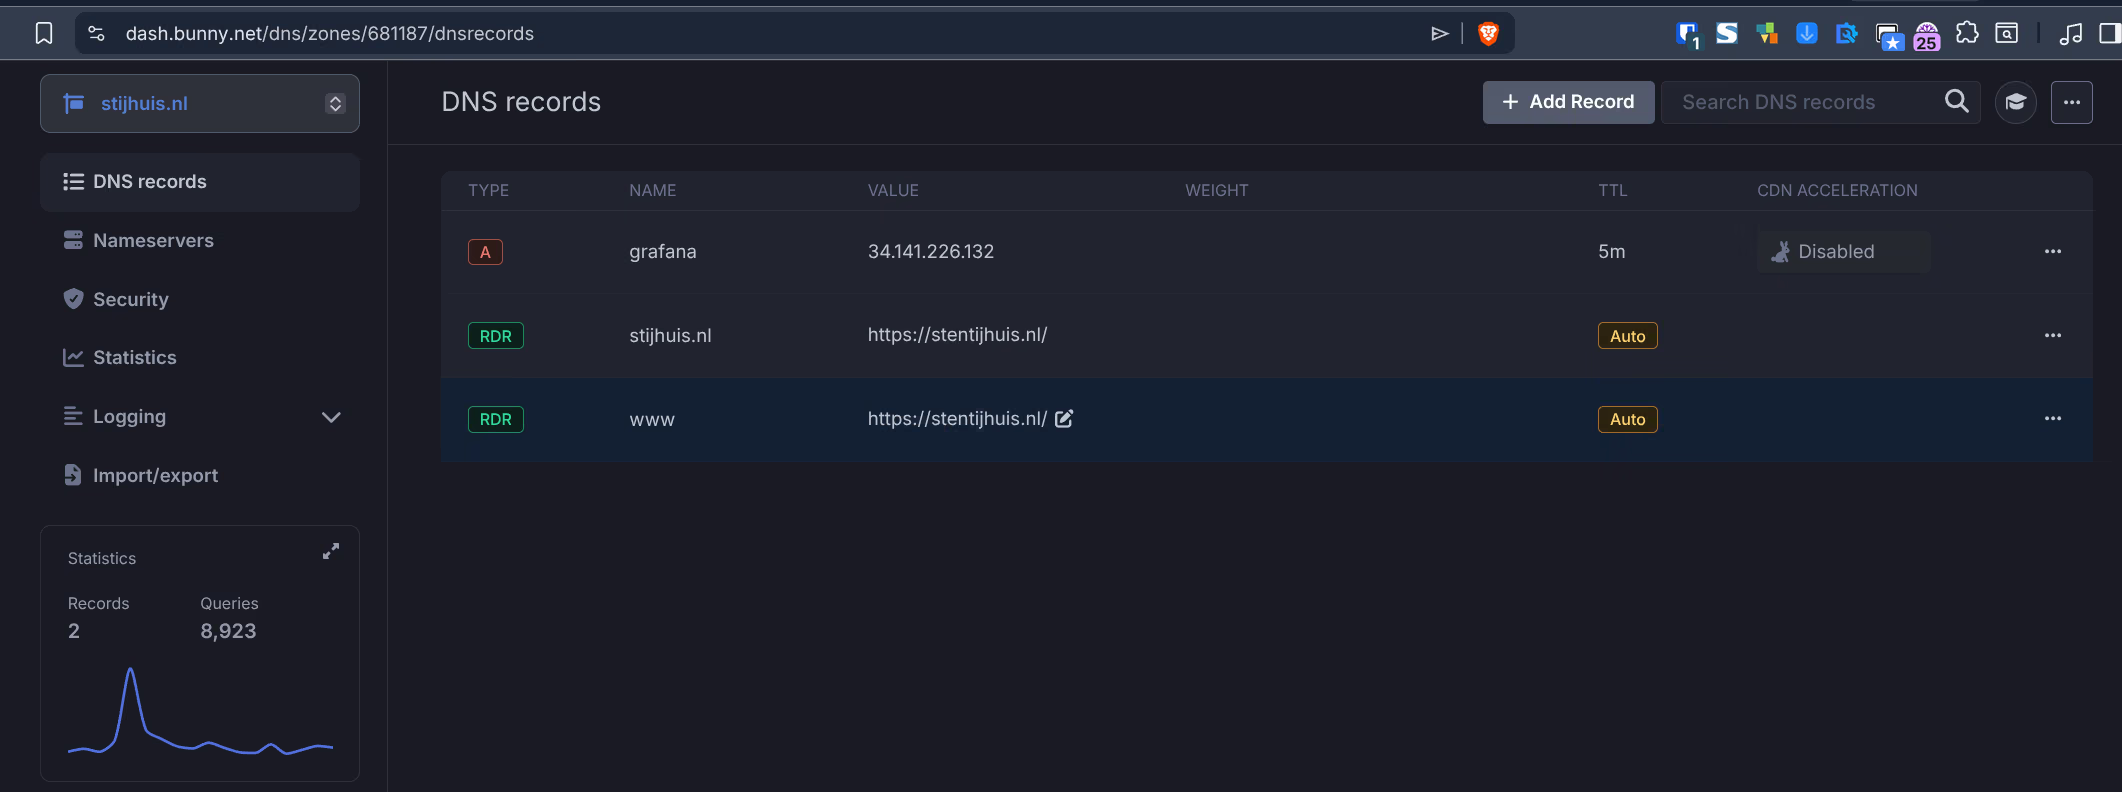
The external IP was set as an A record at Bunny DNS for grafana.stijhuis.nl, instead of manually updating the hosts file. A DNS record works directly on all devices worldwide, without local configuration.
Step 6: Open Grafana
Via https://grafana.stijhuis.nl in the browser:
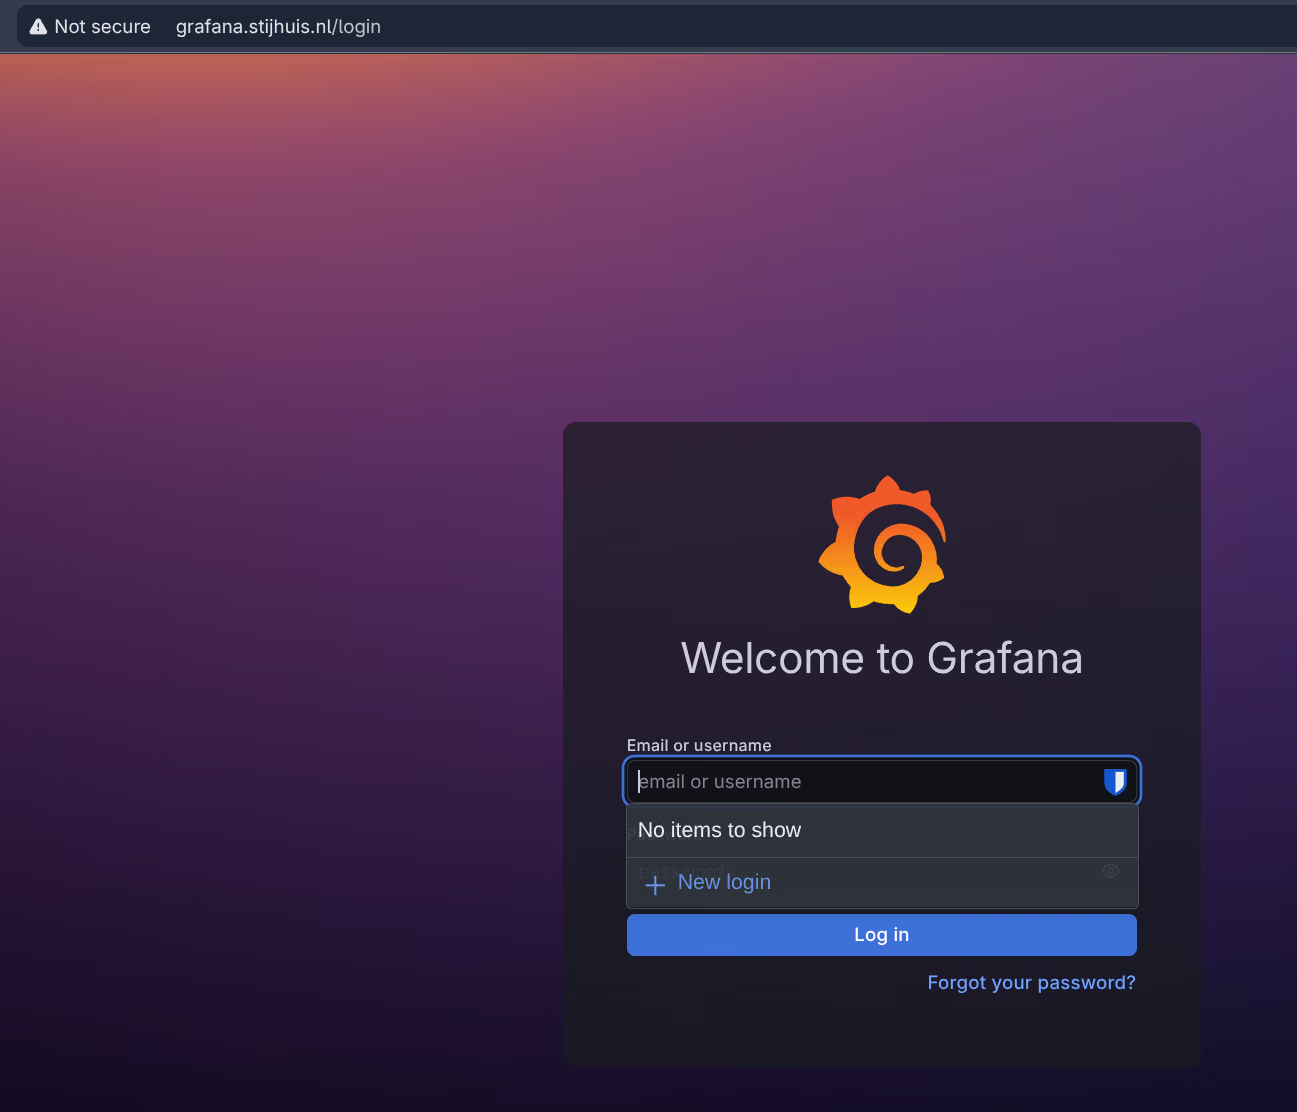
After logging in both datasources are active: Loki and Prometheus. Via Connections > Data sources I tested both sources.
Step 7: Set up dashboards
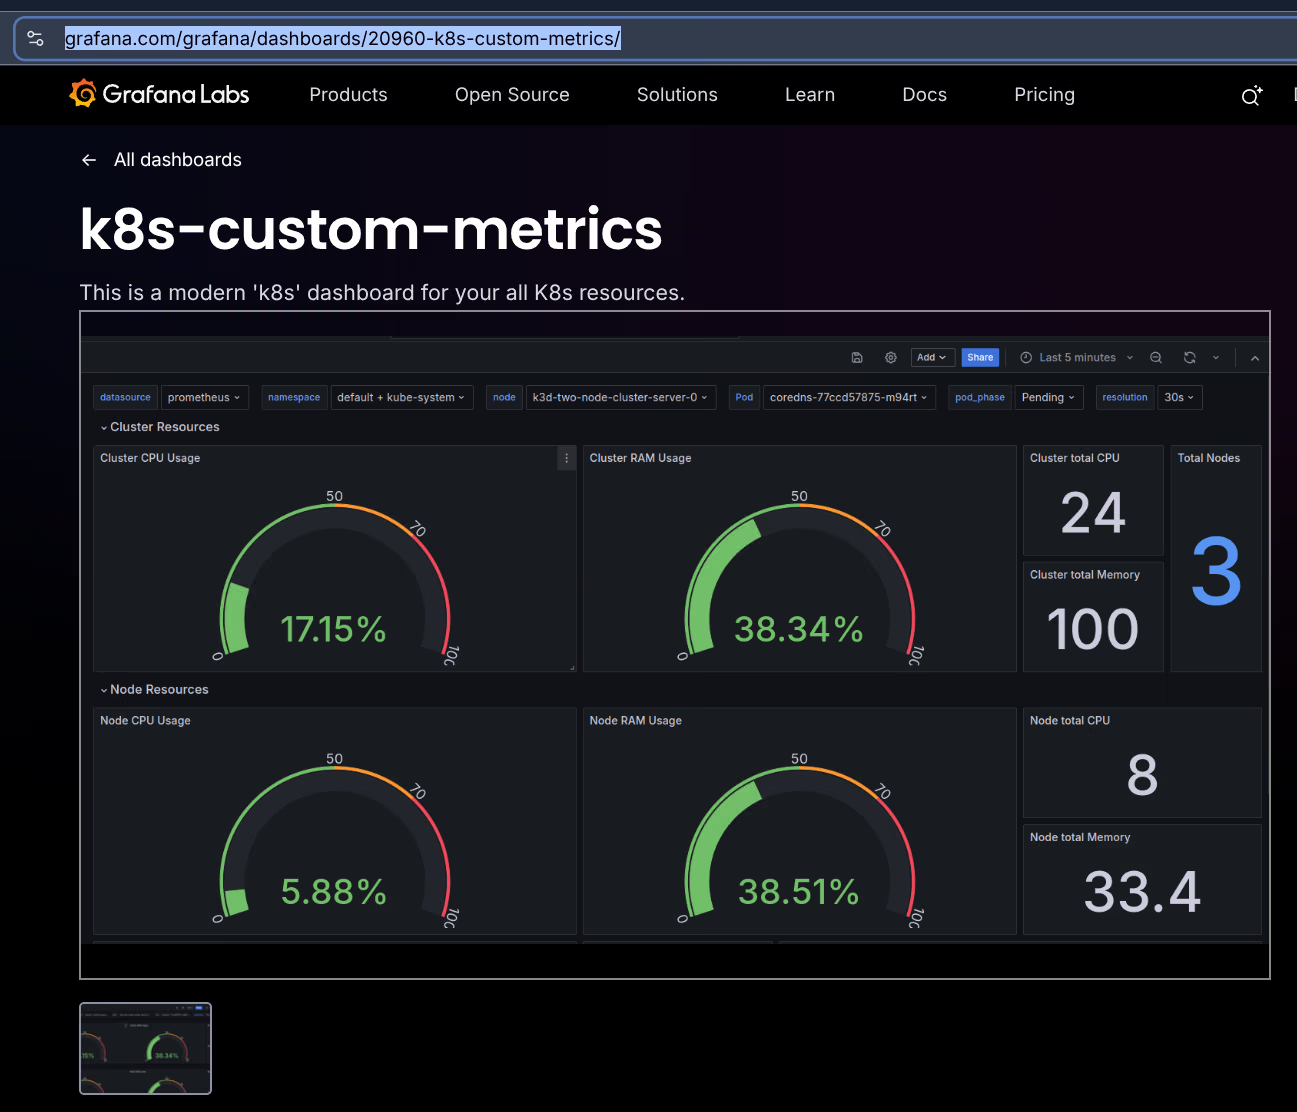
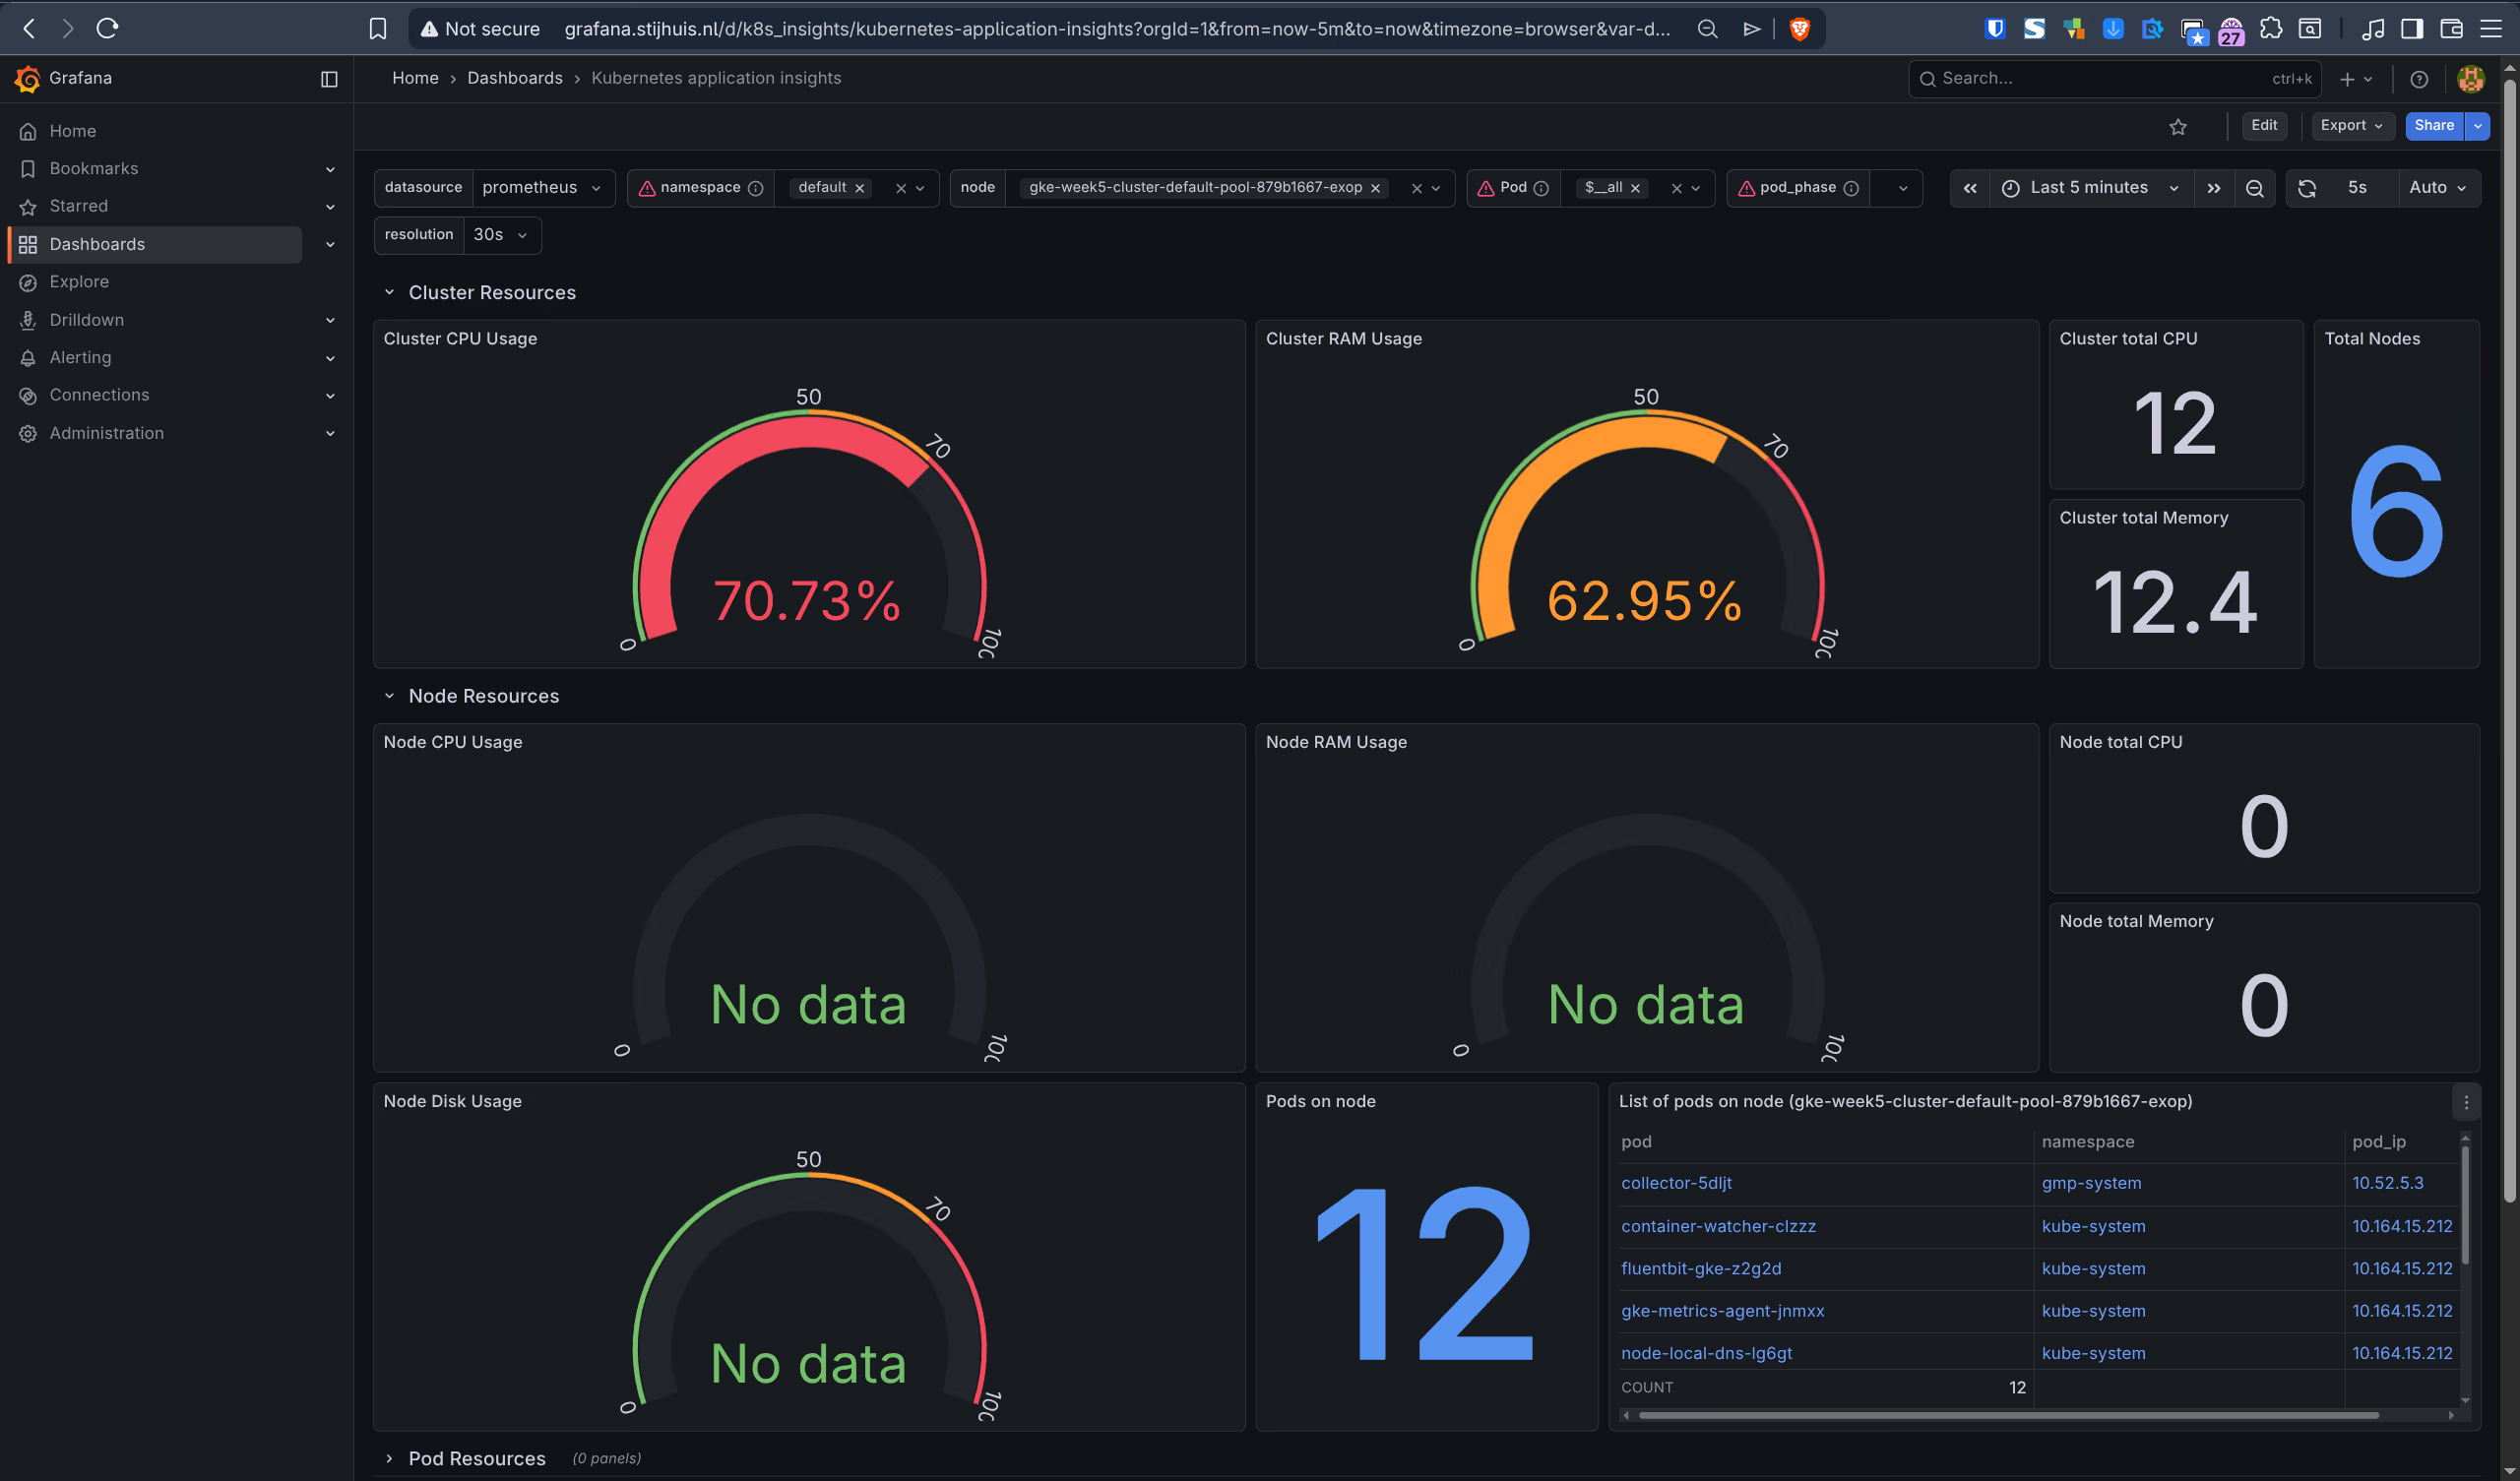
As a base for Kubernetes monitoring the community dashboard k8s-custom-metrics (ID 20960) was used (version 3).
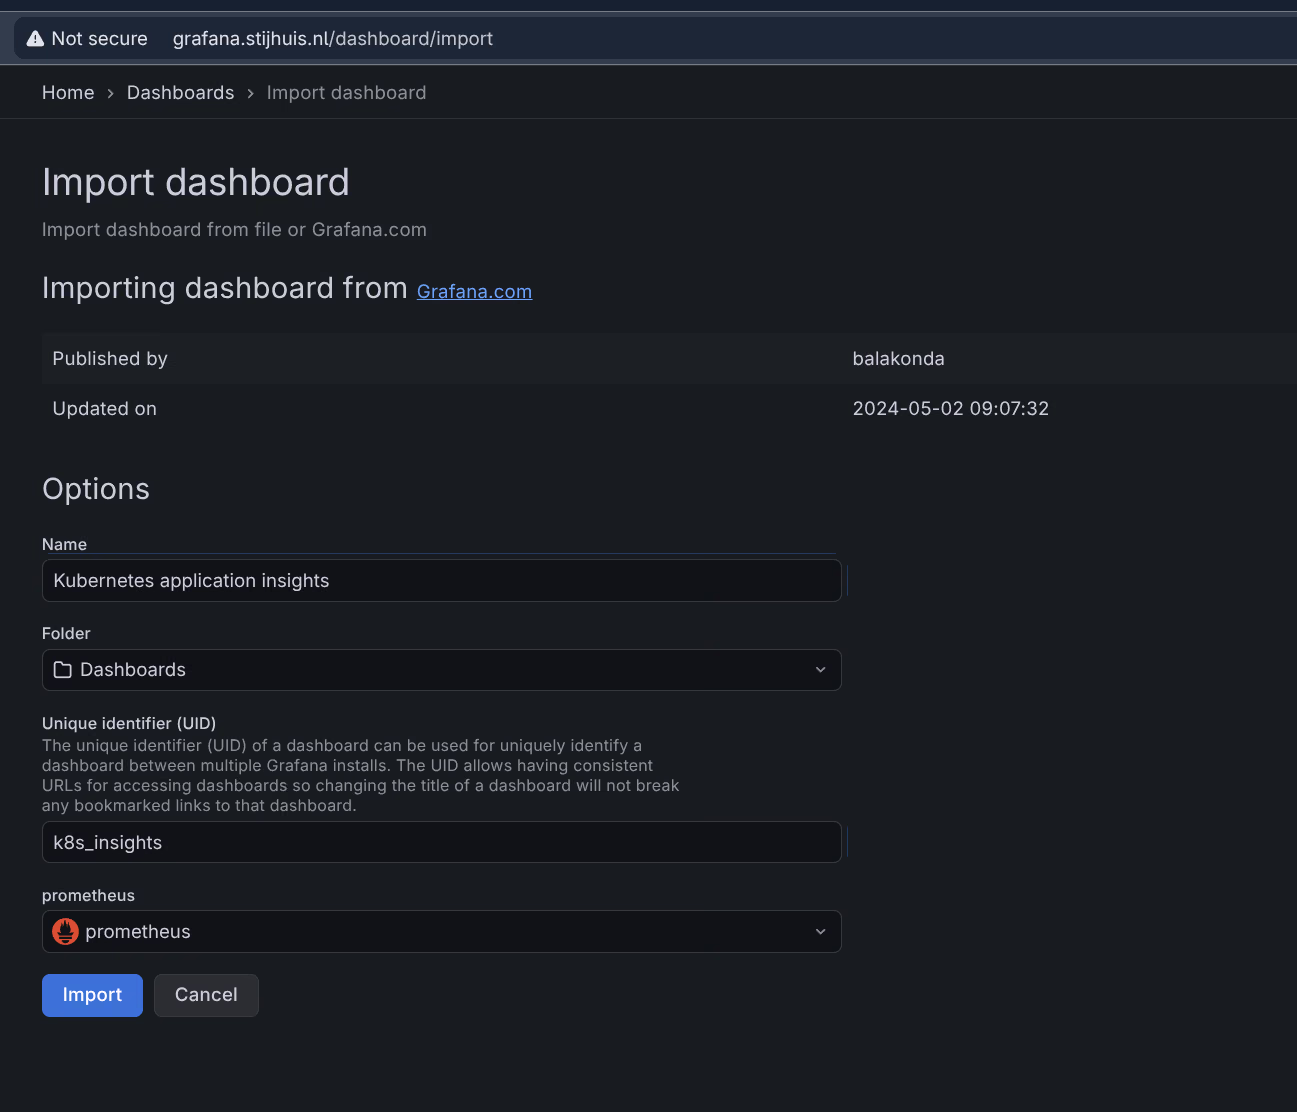
Dashboard imported via Dashboards > Import with ID 20960, Prometheus as datasource:
Step 8: Deploy Week 1 and 2 application
The week 1 application (stensel8/public-cloud-concepts:latest) is a static website served via nginx. Week 2 uses the same Docker image, a separate deployment is not needed for that. The installation script deploys the app automatically as step 6. Since ingress-nginx is already active, the app uses a ClusterIP service with an Ingress.
kubectl get pods -n mywebsite
kubectl get ingress -n mywebsite
Set a DNS A record for mywebsite.stijhuis.nl pointing to the same Ingress IP address as Grafana.
What is there to monitor on a static site?
At first glance not much, but the monitoring stack automatically picks up the following:
- Loki + Alloy reads the nginx access logs: HTTP status codes, request rate, 404s
- kube-state-metrics (part of kube-prometheus-stack): pod availability, restarts, CPU/memory
In Grafana these logs and metrics are directly visible via the Loki and Prometheus datasources. That is exactly what the assignment demonstrates: not the complexity of the app, but the functioning of the monitoring stack.
Step 9: Architecture diagram
The monitoring stack consists of four layers: log collection (Alloy), log storage (Loki), metrics (Prometheus + exporters) and visualisation (Grafana). Ingress-nginx handles external access.
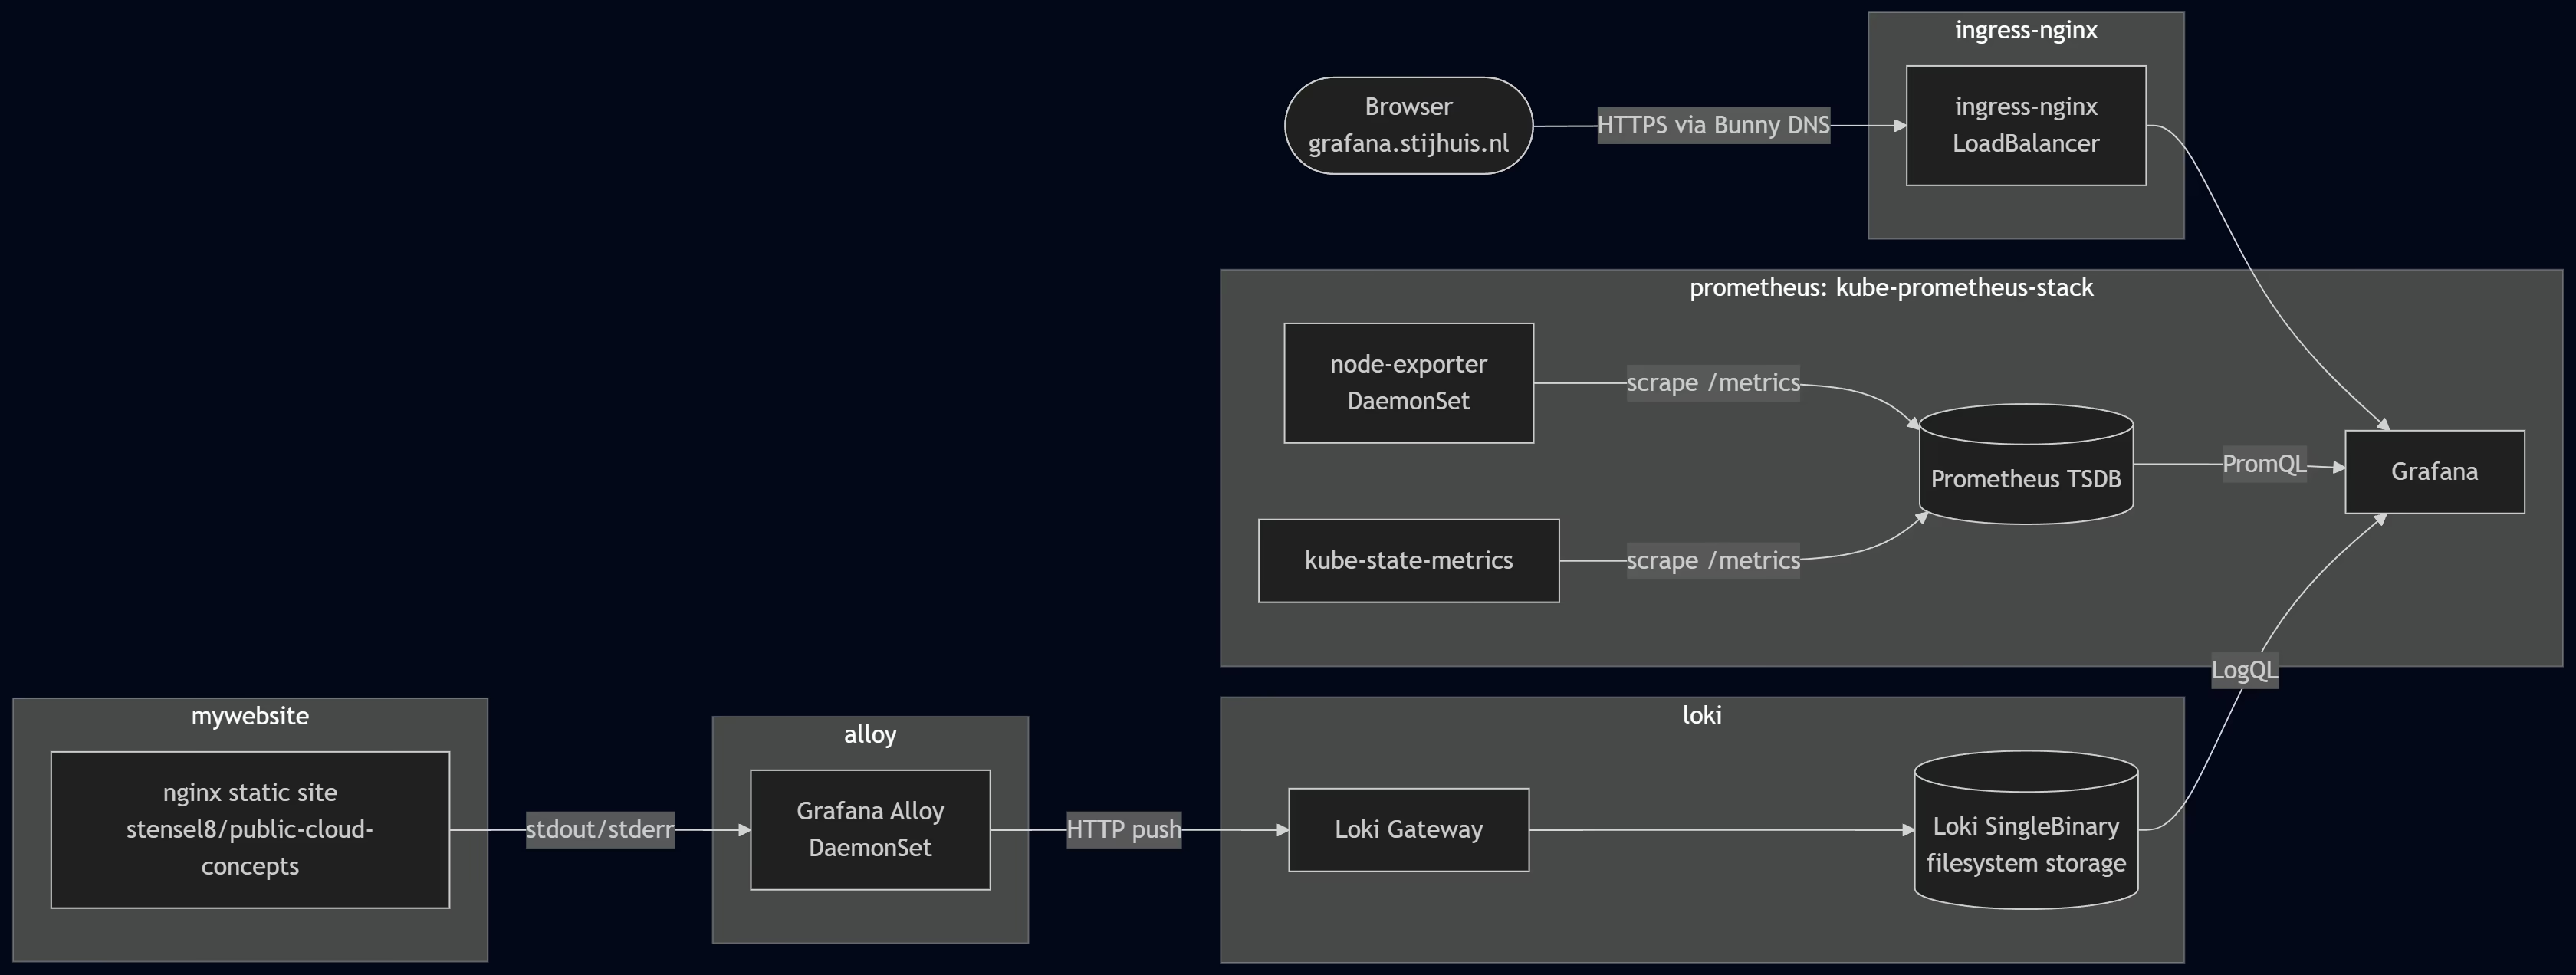
| Component | Namespace | Role |
|---|---|---|
| ingress-nginx | ingress-nginx | External access; exposes Grafana via HTTP Ingress |
| Grafana Alloy | alloy | DaemonSet; reads pod logs via loki.source.kubernetes and forwards them to Loki |
| Loki Gateway | loki | nginx reverse proxy for the Loki API |
| Loki SingleBinary | loki | Log aggregation; stores logs as chunks on the filesystem |
| node-exporter | prometheus | DaemonSet; exports host-level metrics (CPU, RAM, disk, network) |
| kube-state-metrics | prometheus | Exports Kubernetes object status (pods, deployments, replicas) |
| Prometheus | prometheus | Scrapes metrics from node-exporter and kube-state-metrics; stores as TSDB |
| Grafana | prometheus | Visualises metrics (PromQL) and logs (LogQL) via datasources |
Step 10: Other monitoring tools for Kubernetes
The stack I use (Loki, Alloy, Prometheus, Grafana) is open-source and self-hosted. There are also commercial alternatives that offer more out-of-the-box.
Datadog
Datadog is a cloud-native observability platform. You install a DaemonSet (the Datadog Agent) in your cluster, and it then automatically collects metrics, logs, and traces. No separate Helm charts for Prometheus, Loki, and Grafana; everything is in one platform.
Advantage: fast setup, strong integrations, good APM (Application Performance Monitoring) for distributed tracing. Disadvantage: expensive at scale and you are fully dependent on Datadog as a vendor.
New Relic
Similar to Datadog. New Relic also has a Kubernetes integration that automatically monitors cluster health. It has a generous free tier (100 GB/month), which makes it attractive for smaller environments.
Dynatrace
Dynatrace goes further with AI-driven root cause analysis. Instead of just showing dashboards, it tries to automatically determine what is causing a problem. Useful in large, complex environments where manually scrolling through dashboards does not scale.
Comparison with my stack
| My stack | Datadog / New Relic / Dynatrace | |
|---|---|---|
| Cost | Free (open-source) | Paid (per host or data volume) |
| Setup | More configuration needed | Quick installation |
| Vendor lock-in | None | High |
| Flexibility | Fully customisable | Limited to platform capabilities |
| APM / tracing | Set up yourself (Tempo) | Built-in |
For a learning environment, the open-source stack is the better choice: you understand what happens under the hood. In a professional environment with a large cluster, I would consider Datadog or Dynatrace because of the low management overhead.
Step 12: SIEM and SOAR
What is SIEM?
SIEM stands for Security Information and Event Management. A SIEM collects logs and events from all kinds of sources (servers, network devices, applications) and correlates them to detect suspicious behaviour. Well-known examples are Microsoft Sentinel, Splunk, and IBM QRadar.
It is not just about storing logs, but about finding patterns: multiple failed login attempts from the same IP, an account downloading data in the middle of the night, or a new admin who suddenly has access to production.
What is SOAR?
SOAR stands for Security Orchestration, Automation and Response. Where a SIEM detects, a SOAR handles the response. When a SIEM generates an alert, a SOAR can automatically execute a playbook: block the account, create a ticket, notify the administrator.
In combination: SIEM detects an incident, SOAR responds to it automatically.
Link to ITIL
ITIL describes processes for IT service management. Two processes are directly relevant here:
Incident Management is about restoring a service as quickly as possible. A SIEM signals the incident, a SOAR playbook automatically responds and creates a ticket. This directly reduces Mean Time to Detect (MTTD) and Mean Time to Respond (MTTR).
Problem Management goes a step further: what is the underlying cause? From SIEM data you can extract patterns that point to a structural problem, such as an application that consistently requests too many permissions or an endpoint that is regularly targeted by brute-force attacks.
Link to DevOps
In DevOps you want to integrate security throughout the pipeline (DevSecOps). A SIEM/SOAR fits well here:
- Alerts from the SIEM can automatically block a pipeline if suspicious activity has been detected.
- SOAR playbooks can respond automatically without a manual intervention, which fits the DevOps philosophy of automation.
Step 13: TerramEarth case study
TerramEarth manufactures heavy machinery for mining and agriculture. They have 2 million vehicles in use that collect sensor data: critical data goes in real time, the rest is uploaded daily. That is 200-500 MB per vehicle per day. They run on Google Cloud but also have legacy systems on-premise.
An explicit challenge from their executive statement: “improve and standardize tools necessary for application and network monitoring and troubleshooting.” That is exactly the scope of the two products below.
Product 1: Google Cloud Monitoring (Operations Suite)
Google Cloud Monitoring collects metrics, logs, and traces from all Google Cloud resources. Because TerramEarth already runs on Google Cloud, integration is minimal: Cloud Monitoring is available out-of-the-box.
Problem Management:
Tactical level: Cloud Monitoring can analyse trends over longer periods. If vehicle sensors of a certain model consistently report higher CPU load on the processing pipeline, that is a signal for a structural problem in the data processing code. A dashboard with historical trends makes this visible to management.
Operational level: An administrator sees in real time that the ingest pipeline is falling behind. Via Cloud Monitoring Alerts they receive a notification when latency exceeds a threshold. They can immediately trace the cause via the associated logs in Cloud Logging.
Monitoring and Event Management:
Tactical level: Set SLOs (Service Level Objectives) for the data pipeline. TerramEarth can agree that 99.9% of real-time vehicle data must be processed within 5 seconds. Cloud Monitoring continuously monitors this SLO and reports the error budget to management.
Operational level: Automatic alerts on deviations. If a zone suddenly stops receiving data from vehicles in a certain region, an alert fires immediately. This could indicate a network issue or a bug in the on-board firmware.
Product 2: Grafana + Prometheus (self-hosted or via Grafana Cloud)
This is the same stack I use in Week 5. For TerramEarth this is interesting because alongside their Google Cloud environment they also have on-premise legacy systems. Grafana can combine datasources from both environments in one dashboard.
Problem Management:
Tactical level: Grafana has annotations: you can mark events (such as software releases or firmware updates) on graphs. If a new firmware version coincides with a rise in error messages, the correlation is immediately visible. This helps identify the root cause.
Operational level: Via Prometheus alerting, administrators can be automatically notified when a specific vehicle type falls outside normal bandwidth limits. This could indicate a faulty sensor or a network problem in the field.
Monitoring and Event Management:
Tactical level: Because TerramEarth has both Google Cloud and on-premise, a centralised Grafana dashboard is valuable. Prometheus scrapes metrics from both environments, Grafana visualises everything in one place. Management has a complete picture of the infrastructure status.
Operational level: Grafana Alerting can automatically send a webhook to a ticketing system (such as PagerDuty or Jira) on an alert. This is comparable to SOAR: detection and the first step of response are automated.